Abstract
-
Objectives
- The aim of this paper was to determine if a correlation exists between video head impulse test (vHIT) and electronystagmography with caloric test (ENG). More specifically, comparison of covert and overt value from vHIT test with cold and warm stimulation value from ENG test.
-
Methods
- Retrospective study of our single institue from the period of January 2015 to January 2017 enrolled 91 patients. Patients were divided into 3 groups by their diagnosis of either vestibular neuritis (VN), Meniere disease, or sudden sensorineural loss with vertigo accordingly. Each of the patients' both ENG and vHIT data were recorded and parameters were evaluated.
-
Results
- VN group was the only group to show a significant correlation between canal paresis (CP) with covert and overt saccades. Further analysis was done in the VN group and result showed covert saccade showing a larger area under the receiver operation characteristic curve value (0.77) compared to overt saccades (0.70), implying that covert saccade is a more accurate parameter for the prediction of the CP value. Furthermore, a positive correlation was seen between the gain value and the cold caloric stimulation value as well as between warm caloric stimulation value.
-
Conclusion
- The value of our study lies in the fact that we have attempted to find a correlation between different parameters of 2 different vestibular tests. We concluded that the evaluation of overt nystagmus by the bedside head thrust test is inappropriate for predicting CP, and a vHIT is required to accurately evaluate vestibular function.
-
Keywords: Video head impulse test; Caloric test; Vestibular neuritis; Meniere disease; Sudden sensorineural hearing loss
-
중심단어: 비디오 두부충동 검사, 온도안진 검사, 전정 신경염, 메니에르병, 돌발성 난청
INTRODUCTION
Electronystagmography with caloric test (ENG) has been the most widely used objective test for peripheral vestibular dis-orders since its introduction to clinical vestibular testing [1]. The lateral semicircular canals (LSCCs) can be stimulated independently, demonstrating unilateral or bilateral vestibular hypofunction, by the measurement of vestibular ocular reflex (VOR) response to ear-specific irrigation with warm and cold water. This stimulation tests the canal only at very low fre-quencies (around 0.002–0.004 Hz). The video head impulse test (vHIT), introduced in 2009, was proposed to indicate the status of VOR at high frequencies using a high-speed digital camera [2]. In the vHIT, the presence of catch-up saccades when a patient is instructed to stare straight ahead during a brief im-pulse head rotation to the lesion side, is a positive sign of inappropriate VOR [3]. It has moderate sensitivity (35%–45%) and high specificity (90%) [4].
Several studies have recently been performed to assess the correlation between the parameters of the vHIT and caloric test. Perez and Rama-Lopez [5] found that in caloric testing, the clinical head impulse test had a specificity of 91% and a sen-sitivity of 45%. Mahringer and Rambold [6] reported that the vHIT, in comparison with water caloric irrigation (CP defined over 25%), had an overall sensitivity of 41 % and a specificity of 92 % in 172 patients. The use of the vHIT may be a useful addition to the existing vestibular test battery in the assessment of vertigo of vestibular origin [7]. Although both these tests stimulate the LSCC at different speeds, the relationship between the parameters of the 2 tests remains unclear.
In the bithermal caloric test, the parameters include canal paresis (CP), directional preponderance, and maximum slow vel-ocities by warm and cold water stimulation. The parameters in vHIT include overt, covert saccades, and VOR gains. Bithermal caloric test utilizes warm temperature causing ampullopetal sti-mulation, while cold temperatures causes ampullofugal stimu-lation. It is already known in several literatures that warm sti-mulation leads to a more vigorous nystagmus compared to cold stimulation and that warm stimulation demonstrates higher sen-sitivity as well [8]. Warm stimulation in the caloric test and head rotation outwardly in the vHIT both cause ampullopetal stimulation of the LSCC.
In this study, we compared the parameters of vHIT and a bithermal alternating caloric test for the evaluation of dizziness in patients with vestibular neuritis (VN), Meniere disease (MD), and sudden sensorineural hearing loss with vertigo (SSNHLV).
Furthermore, we compared the 3 aforementioned disease entities in order to test the hypothesis that warm stimulation provides better correlation with the parameters of the vHIT compared with cold stimulation.
MATERIALS AND METHODS
1. Subjects
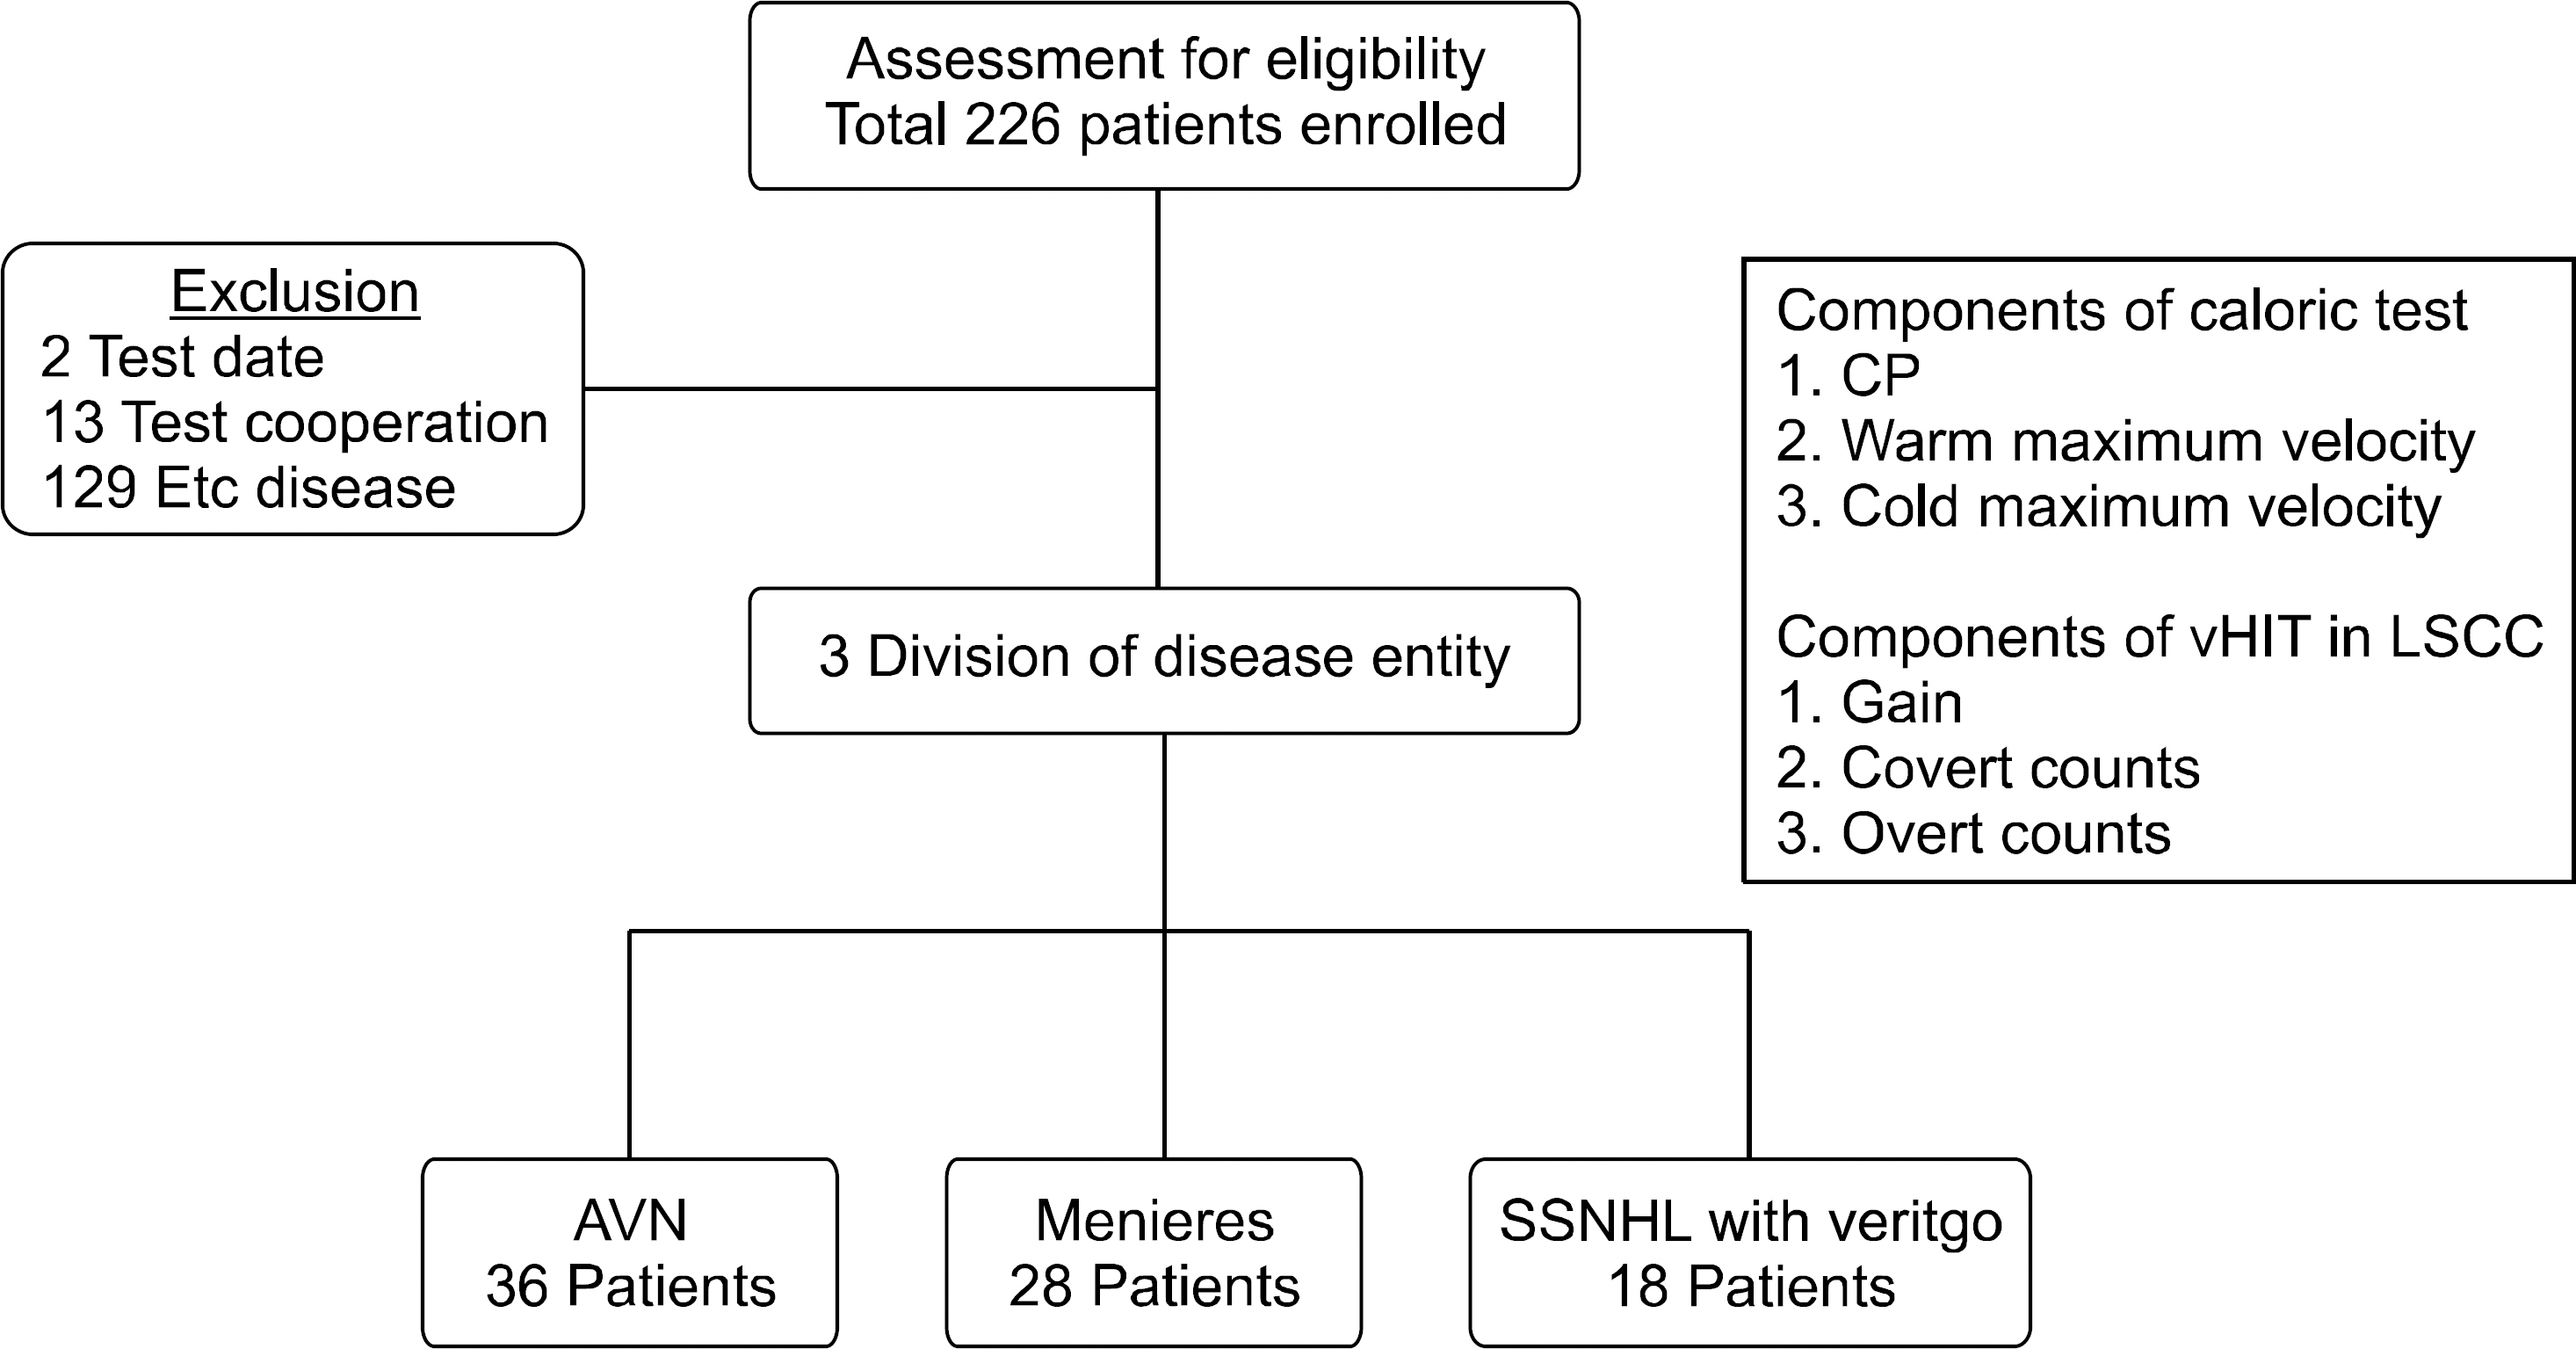
Retrospective study was performed on patients with dizziness who underwent evaluation with both the ENG test and vHIT from January 2015 to January 2017. Patients who were unable to finish both tests or those with an interval of over a week between the tests, and those with a diagnosis other than the 3 diseases studied (VN, MD, and SSNHLV, as diagnosed by professional otorhinolaryngologist) were excluded. Of the total 226 patients initially enrolled, 135 patients were excluded as per our criteria. The remaining 91 patients were subsequently divided into 3 groups according to their diagnosis of VN, MD, or SSNHLV. The VN group consisted of 36 patients (22 males and 14 females), MD group with 28 patients (7 males and 21 females), and SSNHLV group with 18 patients (6 males and 12 females). The mean ages for each group were 58.9±11.2, 46.7±13.0, and 60.6±18.2 years, respectively. The study popu-lation is shown in Fig. 1.
Fig. 1.Retrospective patient se-lection criteria. Out of retrospectively enrolled 226 patients, 3 were excluded due to having a test inter-val of over a week between the 2 vestibular tests, 13 were excluded due to being unable to finish the 2 vestibular tests, and 129 were ex-cluded due to a diagnosis other than that of vestibular neuritis, Meniere disease, or sudden sensorineural hearing loss with vertigo. CP, canal paresis; vHIT, video head impulse test; LSCC, lateral semicircular ca-nal; AVN, acute vestibular neuritis; SSNHL, sudden sensorineural hearing loss.

All material in the manuscript has been acquired according to modern ethical standards and has been approved by the Institutional Review Board (IRB) of Wonju Severance Christian Hospital (IRB number: CR319087).
2. Vestibular Examination
ENG was performed with the Micromedical Technologies Visual Eyes (e3 Diagnostics, Arlington Heights, IL, USA) bino-cular, with the patient placed in a supine position and with the head tilted 30° forward. Unilateral 30℃ (cold) and 44℃ (warm) water irrigations with 20 mL of water were performed on both sides of the ear for over 20 seconds. The eye movement re-sponse was recorded for 180 seconds and a resting period of 5 minutes was observed between recordings. The maximal slow- phase velocity of caloric nystagmus was determined during the time interval between 30 seconds and 90 seconds from the beginning of the irrigation. The horizontal semicircular canal was measured by tracking eye movement at 100 Hz, with CP of over 25% defined as abnormal. CP was quantified using the Jongkees formula (1966). The vHIT was performed using the EyeSeeCam (Interacoustics, Middelfart, Denmark), measuring catch-up saccade of all 6 semicircular canals at 250 Hz and recording gain measurements of 30–60 msec. The criteria for a normal vestibulo-ocular reflex (VOR) velocity gain was 0.79 or greater, which is based on HIT data from previously pub-lished papers [9]. The specific procedure for the vHIT was as follows: subjects were instructed to fix their gaze upon a laser dot on a screen at approximately 1-m distance in a dimly lit room. Approximately 20 head impulses in the planes of the canals were delivered by the examiner, with unpredictable di-rection and timing. Head impulses were automatically detected and aligned at peak head acceleration. Saccades were detected using an eye acceleration algorithm. The gain of the VOR was calculated for both recording methods as the ratio of cumulative slow-phase eye velocity over cumulative head velocity from the onset of the head impulse to the moment when head velocity returned to zero. The boundary points were defined from 60 msec before peak head acceleration to the final value of 0 μ/sec as the head returned to rest.
3. Statistical Analysis
Statistical analysis was performed using the SAS 9.4 MedCalc (SAS Institute Inc., Cary, NC, USA) package. Data is shown in terms of mean and standard deviation. The comparison of each variable between groups was performed using the Kruskal- Wallis test or the chi-square test. The correlation of the covert, overt, and gain values measured for CP were analyzed by conducting a McNemar test in order to determine whether a statistically significant correlation exists between each of the 2 values. A receiver operation characteristic (ROC) curve was used to assess the accuracy of covert and overt values in order to determine which value has a more accurate prediction of a positive CP value, using CP as a dependent variable. The warm and cold caloric stimulation values correlated with the gain value using the Pearson correlation coefficient, and the results were visually depicted using a scatter plot. The 2-correlation coefficient was compared using a Fisher Z-test. The VN group was later analyzed alone using Pearson correlation coefficient and Fisher Z-test due to the fact that it was the only statistically significant disease entity of the 3 groups tested.
RESULTS
1. Clinical Characteristics of the Participants
The VN group showed the highest average CP value (58.5) and the SSNHLV group was second highest with an average CP value of 28.5, followed by the MD group with average CP value of 9.5. The lowest average gain value was 0.67±0.31 from the VN group, followed by 0.67±0.27 for SSNHLV group, and MD group exhibited the highest average gain value with 0.90± 0.17. According to our vHIT measurements, 30.6% of the VN patients tested showed covert saccades and 55.6% with overt saccades. MD group showed 25% of covert saccades and 32.1% with overt saccades. Finally, 44.4% of SSNHLV group had covert saccades and 61.1% with overt saccades. However, neither of covert and overt saccades were statically significant for the 3 disease entity. The only statistically significant para-meters from the 3 disease groups were CP, warm velocity value, cold velocity value, and gain value. The clinical characterstics of the population is shown in Table 1.
Table 1.Epidemiologica and clinical characteristics of participants
|
Characteristic |
Vestibular neuritis (n=36) |
Meniere disease (n=28) |
SSNHL with vertigo (n=18) |
p-value |
|
Age (yr) |
58.9±11.2 |
46.7±13.0 |
60.5±18.2 |
0.001*
|
|
Male sex |
22 (61) |
7 (25) |
6 (33) |
0.010*
|
|
Duration gap of tests (day) |
0 |
0 |
0 |
0.885 |
|
Caloric test |
|
|
|
|
|
Mean canal paresis |
58.5 |
9.5 |
28 |
<0.000*
|
|
Mean directional preponderance |
26 |
14 |
17.5 |
0.104 |
|
Max. velocity – Warm |
7±8 |
18±11 |
13±15 |
<0.000*
|
|
Max. velocity – Cold |
12±6 |
21±12 |
14±7.9 |
< 0.000*
|
|
vHIT |
|
|
|
|
|
Gain |
0.67±0.31 |
0.90±0.17 |
0.67±0.27 |
0.002*
|
|
Covert (+) |
30.6% |
25% |
44.4% |
0.377 |
|
Overt (+) |
55.6% |
32.1% |
61.1% |
0.088 |
2. Correlation of CP in Caloric Test with Covert, Overt, and Gain in vHIT
For each disease group, CP value from the ENG test was compared with the covert, overt saccades, and gain values from vHIT test (Table 2). In the VN group, CP and covert saccades showed a statistically significant correlation (p=0.001). There was also a significant correlation between CP and overt sac-cades (p=0.001). In the MD group, neither covert nor overt saccades showed significant correlation (p=1.00 for both). The same was true for the SSNHLV group (p=1.00 for both). None of the 3 disease entities showed a significant correlation be-tween CP and gain (p=1.00 for all 3 disease entities). The VN group was the only one to show a significant correlation be-tween CP with covert and overt saccades. Therefore, the VN group was the only group in our study to undergo further analysis. Using logistic regression methods, an ROC curve for the VN group was analyzed to evaluate the accuracy of covert and overt saccades in relation to CP. As depicted in Fig. 2, covert saccades shows a larger area under the curve value (0.77) compared to overt saccades (0.70), implying that the presence of covert saccades is a more accurate parameter for the prediction of the CP value.
Table 2.Correlation between covert and overt measurements of CP for different disease entities
|
|
Covert
|
p-value |
Overt
|
p-value |
Gain
|
p-value |
|
– |
+ |
Sum |
– |
+ |
Sum |
– |
+ |
Sum |
|
Vestibular neuritis |
|
CP |
|
+ |
25 (69.4) |
11 (30.6) |
36 (100) |
<0.000*
|
16 (44.4) |
20 (55.6) |
36 (100) |
<0.000*
|
17 (47.2) |
19 (52.8) |
36 (100) |
1.000 |
|
Sum |
25 (69.4) |
11 (30.6) |
36 (100) |
|
16 (44.4) |
20 (55.6) |
36 (100) |
|
17 (47.2) |
19 (52.8) |
36 (100) |
|
|
Meniere disease |
|
CP |
|
– |
18 (64.3) |
2 (7.1) |
20 (71.4) |
1.000 |
15 (53.6) |
5 (17.9) |
20 (71.4) |
1.000 |
1 (3.6) |
19 (67.9) |
20 (71.4) |
1.000 |
|
+ |
3 (10.7) |
5 (17.9) |
8 (28.6) |
|
4 (14.3) |
4 (14.3) |
8 (28.6) |
|
2 (7.1) |
6 (21.4) |
8 (28.6) |
|
|
Sum |
21 (75.0) |
7 (25.0) |
28 (100) |
|
19 (67.9) |
9 (32.1) |
28 (100) |
|
3 (10.7) |
25 (89.3) |
28 (100) |
|
|
SSNHL with vertigo |
|
CP |
|
– |
8 (44.4) |
1 (5.6) |
9 (50.0) |
1.000 |
4 (22.2) |
5 (27.8) |
9 (50) |
0.727 |
3 (16.7) |
6 (33.3) |
9 (50.0) |
1.000 |
|
+ |
2 (11.1) |
7 (38.9) |
9 (50.0) |
|
3 (16.7) |
6 (33.3) |
9 (50) |
|
5 (27.8) |
4 (22.2) |
9 (50.0) |
|
|
Sum |
10 (55.6) |
8 (44.4) |
18 (100) |
|
7 (38.9) |
11 (61.1) |
18 (100) |
|
8 (44.4) |
10 (55.6) |
18 (100) |
|
Fig. 2.Receiver operation characteristic curve for covert and overt measurements in canal paresis. Covert saccades show a larger area under the curve (AUC) (0.77) value compared to overt saccades (0.70). The odds ratio for covert saccades is 7.44, with a p-value of 0.0047. SE, standard error; OR, odds ratio; CI, confidence interval.

3. Correlation of Gain in vHIT with Maximum Velocity of Warm and Cold Caloric Stimulation
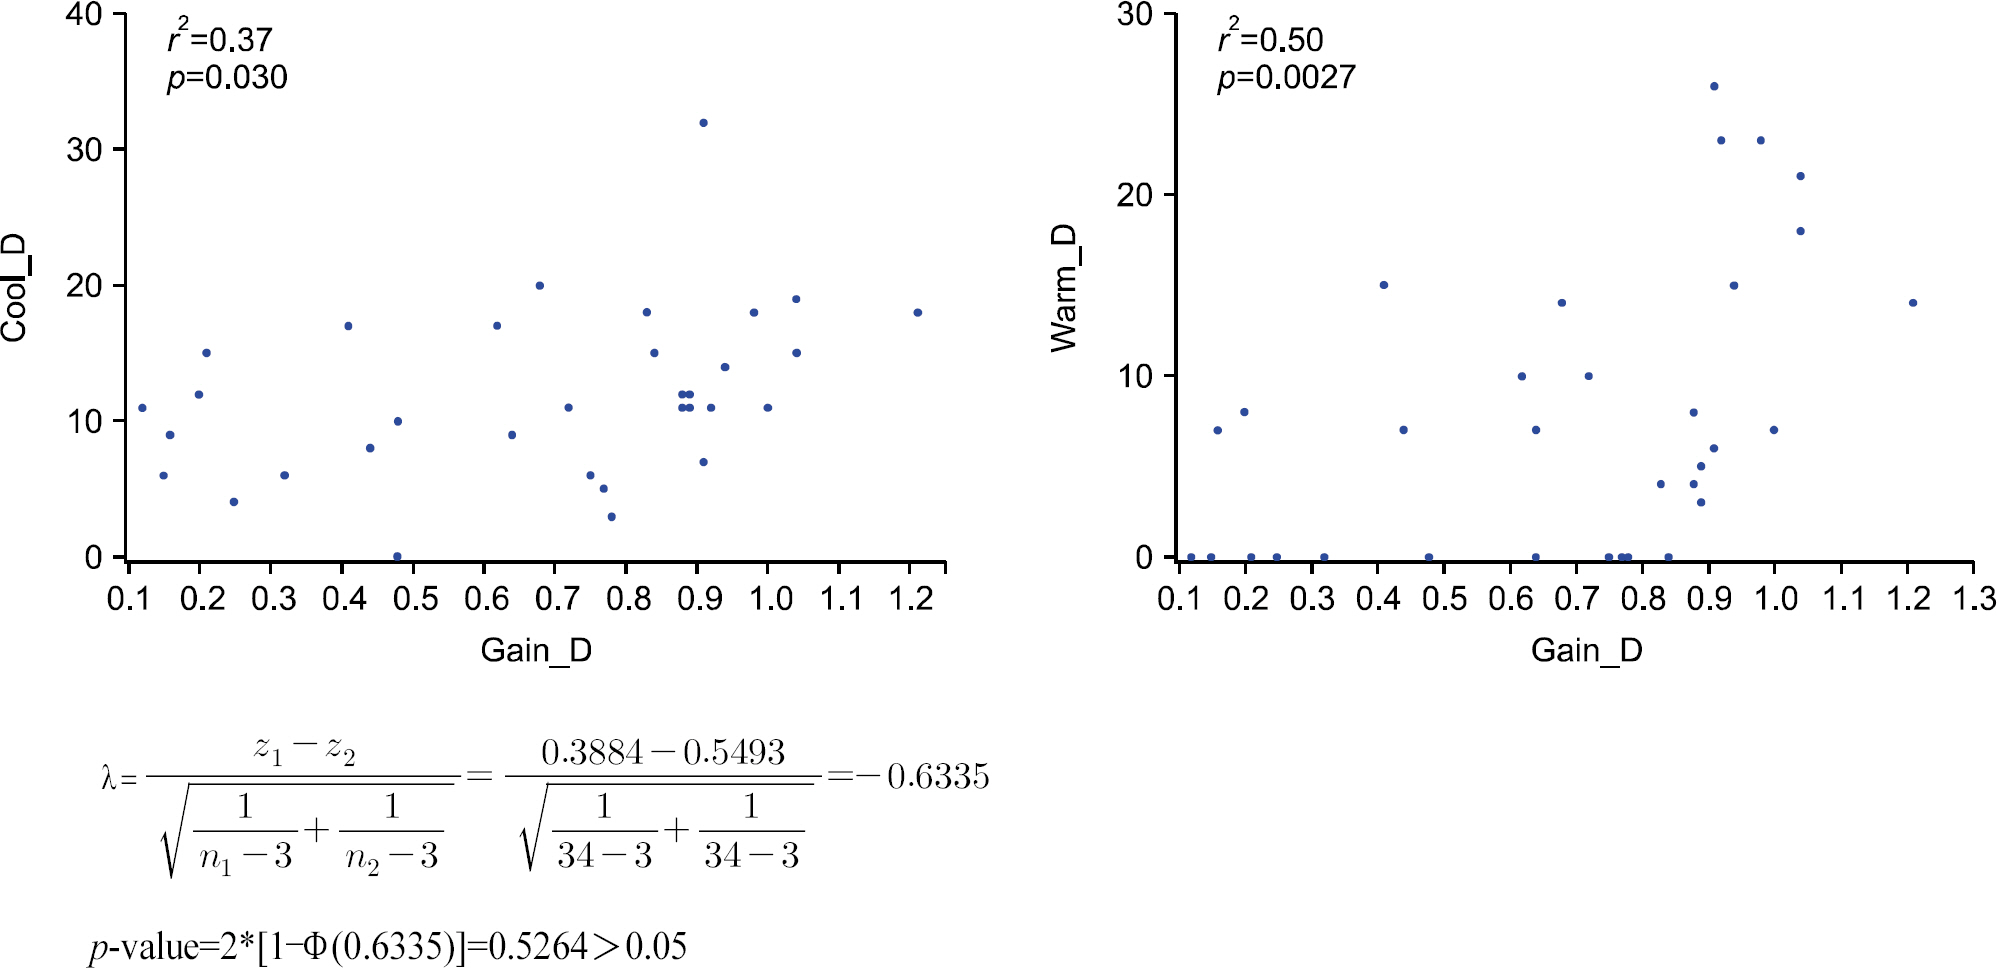
We then analyzed the VN group, correlating the gain value therein with the warm and cold caloric testing values. A positive correlation was seen between the gain value and the cold caloric stimulation value (r2=0.37), as well as between the gain value and the warm caloric stimulation value (r2=0.50) seen in Fig. 3. When Fisher Z-test was applied, both cold and warm caloric stimulation values showed a positive linear correlation with the gain value. However, there was no sig-nificant difference between the cold and warm values when compared with each other. Therefore, we could not determine which of the cold or warm caloric stimulation value was more closely correlated with the gain value. However, warm caloric stimulation value (r2=0.50, p=0.0027) did show a higher positive linearity compared to the cold caloric stimulation value (r2= 0.37, p=0.03), leading us to believe that further study should be done on this matter.
Fig. 3.Correlation scatter plot of gain value in video head impulse test with cold and warm caloric test slow maximum velocity.
DISCUSSION
There are 2 most commonly used clinical methods of mea-suring LSCC vestibular function; the caloric test and the vHIT. The caloric input corresponds to very low frequencies of vesti-bular stimulation, analogous to 0.003 Hz. The vHIT is limited to higher frequencies of vestibular stimulation, predominantly at 2.5 Hz [10]. These methods test the dynamic responses of the horizontal angular VOR and can identify unilateral vesti-bular dysfunction. However, the vHIT does not replace the caloric test, as these tests are different in their identification of unilateral vestibular loss [6,11,12]. Many clinics apply both of the tools in the evaluation of dizziness and there is an increasing need to examine each of the 2 tools. We have evalu-ated the 2 tools in question and have examined the component parts of each method in order to discover any correlations which exist between the 2 tests and how these are affected when they are applied in different disease states.
Our results showed some notable correlation between the caloric test and vHIT for the VN group, reason which we believe that this acute disease were evaluated shortly after the appearance of their symptoms. However, the lack of correlation with CP and vHIT gain in our VN group was rather unexpected. Various reasons could be argued including patients with less damaging CP could reflect lower correlation with its gain [13]. Kazuo and Yasushi [14] have also reported numbers of peri-pheral vestibular imbalance patients with no response to caloric stimulation failing to exceed the range of normal VOR gain, suggesting that VOR gain alone should not be used to estimate vestibular function. This is a similar message, which we also agree upon. We also recommend the consideration of saccades alongside with CP value for vestibular assessment. For patients in the MD group, there were no correlation between vHIT and caloric test whatsoever. Several studies have also shown dis-parity between CP and vHIT in regard to diagnosis of MD. Fukushima et al. explained such phenonomen as the possibility of enlarged hydrops affecting vestibule, which will affect the caloric response while not affecting the vHIT response [15–17]. The fact that our MD group have also shown the same disparity is an evidence of accurate patient selection. In patients with SSNHLV, the vHIT had better correlation than the caloric test. This may be due to the fact that the vHIT is more sensitive than the caloric test in terms of short-term loss of vestibular function [18].
In the VN group, patients with positive covert saccades were more likely to have a larger degree of CP than patients without covert nystagmus, with an odds ratio of 7.44. Therefore, we can conclude that the evaluation of overt nystagmus by the bedside head thrust test is inappropriate for predicting CP, and a vHIT is required to accurately evaluate vestibular function. However, our test does not take into account of possible changes relating to disease duration. This should be noted as a limitation and further study is required here.
Of note, we compared the gain value from the vHIT with the warm and cold stimulation values from the caloric test to see which parameter better represented vestibular loss, and the warm caloric stimulation value produced a higher r2. Although it did not reach statistical significance in our small number of test group, we believe a future study consisting of larger popu-lation may show otherwise. It is well known that warm sti-mulation has a greater stimulating effect on LSCC than cold stimulation and our test result is consistent with this fact. For patients with severe dizziness unable to tolerate a full bithermal caloric test; instead a monothermal warm caloric test could be a viable option, and the results can be expected to correlate with a lower gain value from the vHIT. Conversely, vHIT could replace the role of caloric test for those who are unable to undergo this test, such as with chronic otitis media. We can also expect these patients to have decreased warm caloric re-sponse.
The value of our study lies in the fact that we have attempted to find a correlation between different parameters of 2 different tests. Although this is a retrospective study, the fact that we divided our study population in to 3 homogenous groups and controlled the study duration increases the reliability of our study results. The relationship between CP with covert saccades will provide important clues for otologists about the loss of LSCC function. Further studies are required to assess the recovery rate from LSCC function loss and to ascertain whether recovery of this sort may change the relationship between test parameters.
ARTICLE INFORMATION
-
No potential conflict of interest relevant to this article was reported.
Acknowledgments
ACKNOWLEDGMENT
This work was supported by the National Research Foun-dation of Korea (NRF) grant funded by the Korea government (MSIT) (No. NRF-2020R1A2C 1009789).
REFERENCES
- 1. Bhansali SA, Honrubia V. Current status of electronystagmography testing. Otolaryngol Head Neck Surg 1999;120:419–26.ArticlePubMed
- 2. MacDougall HG, Weber KP, McGarvie LA, Halmagyi GM, Curthoys IS. The video head impulse test: diagnostic accuracy in peripheral vestibulopathy. Neurology 2009;73:1134–41.ArticlePubMedPMC
- 3. Park P, Park JH, Kim JS, Koo JW. Role of video-head impulse test in lateralization of vestibulopathy: comparative study with caloric test. Auris Nasus Larynx 2017;44:648–54.ArticlePubMed
- 4. Beynon GJ, Jani P, Baguley DM. A clinical evaluation of head impulse testing. Clin Otolaryngol Allied Sci 1998;23:117–22.ArticlePubMed
- 5. Perez N, Rama-Lopez J. Head-impulse and caloric tests in patients with dizziness. Otol Neurotol 2003;24:913–7.ArticlePubMed
- 6. Mahringer A, Rambold HA. Caloric test and video-head-impulse: a study of vertigo/dizziness patients in a community hospital. Eur Arch Otorhinolaryngol 2014;271:463–72.ArticlePubMedPDF
- 7. Bell SL, Barker F, Heselton H, MacKenzie E, Dewhurst D, Sanderson A. A study of the relationship between the video head impulse test and air calorics. Eur Arch Otorhinolaryngol 2014;272:1287–94.ArticlePubMedPDF
- 8. Bush ML, Bingcang CM, Chang ET, Fornwalt B, Rayle C, Gal TJ, et al. Hot or cold? Is monothermal caloric testing useful and cost-effective? Ann Otol Rhinol Laryngol 2013;122:412–6.ArticlePubMed
- 9. Weber KP, Aw ST, Todd MJ, McGarvie LA, Curthoys IS, Halmagyi GM. Head impulse test in unilateral vestibular loss: vestibulo-ocular reflex and catch-up saccades. Neurology 2008;70:454–63.ArticlePubMed
- 10. Hain TC, Cherchi M, Perez-Fernandez N. The gain-time constant product quantifies total vestibular output in bilateral vestibular loss. Front Neurol 2018;9:193–6.ArticlePubMedPMC
- 11. Zellhuber S, Mahringer A, Rambold HA. Relation of video-head-impulse test and caloric irrigation: a study on the recovery in unilateral vestibular neuritis. Eur Arch Otorhinolaryngol 2014;271:2375–83.ArticlePubMedPDF
- 12. Bartolomeo M, Biboulet R, Pierre G, Mondain M, Uziel A, Venail F. Value of the video head impulse test in assessing vestibular deficits following vestibular neuritis. Eur Arch Otorhinolaryngol 2014;271:681–8.ArticlePubMedPDF
- 13. Paloma EN, Concepcion FA, Nicolas PF. The caloric test and the video head impulse test in patients with vertigo. Int Adv Otol 2014;10:144–9.Article
- 14. Kazuo F, Yasushi N. Validity and limitation of detection of peripheral vestibular imbalance from analysis of manually rotated vestibulo-ocular reflex recorded in the routine vestibular clinic. Acta Otolaryngol 2002;122:31–6.ArticlePubMed
- 15. Seo T, Node M, Miyamoto A, Yukimasa A, Terada T, Sakagami M. Three cases of cochleosaccular endolymphatic hydrops without vertigo revealed by furosemide-loading vestibular evoked myogenic potential test. Otol Neurotol 2003;24:807–11.ArticlePubMed
- 16. van Esch BF, van Benthem PPG, van der Zaag- Loonen HJ, Bruintjes TD. Two common second causes of dizziness in patients with Méniere's disease. Otol Neurotol 2016;37:1620–4.ArticlePubMed
- 17. Munehisa F, Ryohei O, Kengo N, Hirotaka E, Shiro A, Hidenori I, et al. Vertical head impulse and caloric are complementary but react opposite to meniere's disease hydrops. Laryngoscope 2019;129:1660–6.ArticlePubMed
- 18. Lee JH, Kim SH, Jung J. Long-term changes in video head impulse and caloric tests in patients with unilateral vestibular neuritis. Korean J Otorhinolaryngol-Head Neck Surg 2019;62:23–7.ArticlePDF
Citations
Citations to this article as recorded by

- A Comparative Analysis of the Vestibulocochlear Function in Patients with Isolated Semicircular Canal Hypofunction Using a Video Head Impulse Test
Yu Jung Park, Min Young Lee, Ji Eun Choi, Jae Yun Jung, Jung Hwa Bahng
Research in Vestibular Science.2023; 22(2): 34. CrossRef


 PubReader
 ePub Link
 Cite
Cite