Abstract
-
Objectives
- Big data analytics in healthcare research have gained momentum, offering unprecedented opportunities to investigate complex medical conditions like acute vestibular neuritis (AVN). However, an inappropriate definition can introduce bias and inaccuracies into prevalence estimation, making the results unreliable and hindering cross-study comparisons. The Health Insurance data in South Korea will be used to create a robust operational definition for AVN.
-
Methods
- The study utilized the National Patients Sample dataset from the Health Insurance Review and Assessment Service (HIRA) of the Republic of Korea. The operational definition of AVN was defined using the HIRA data, which includes specific codes for diagnosis, testing, and medications. The revised categorization scheme for AVN was presented as case 1 through case 5, with criteria for each category.
-
Results
- The optimal conditions are deemed to be those that encompass the outcomes of both case 5 and case 1-1, encompassing all conditions. The study also provided prevalence estimates for subgroups based on demographic factors (age, sex), and found a consistent pattern throughout all years, sex, and age.
-
Conclusions
- The study analyzed the prevalence of AVN in case 1 and case 5, which were similar to the reference prevalence of 3.5 per 100,000 people reported in other countries. The study’s results are encouraging for several reasons, including the validity of the operational definitions used, and the agreement between the study’s prevalence estimates and the reference prevalence. The operational definition in statistics, in the context of big data, serves as a precise and standardized criterion.
-
Keywords: Vestibular neuritis; Prevalence; Big data; Health insurance; Routinely collected health data
-
중심단어: 전정신경염, 유병률, 빅데이터, 건강 보험, 보건의료 데이터
INTRODUCTION
Acute vestibular neuritis (AVN) is a debilitating vestibular disorder characterized by sudden-onset vertigo, imbalance, and nausea, often accompanied by nystagmus [1]. The condition is primarily caused by inflammation of the vestibular nerve, leading to disturbances in the transmission of sensory information from the inner ear to the brain. AVN significantly impacts the quality of life of affected individuals, causing disruptions in daily activities and imposing substantial healthcare burdens [2].
The annual incidence of 3.5 cases per 100,000 population signifies the rate at which new cases of AVN are diagnosed each year [3]. Meanwhile, the fact that it accounts for 7% of patients at outpatient clinics focusing on vertigo treatment highlights its significance among individuals seeking care for vertigo-related issues. It is worth noting that the prevalence of AVN might be underestimated due to misdiagnosis or underreporting, as symptoms can be mistaken for other vestibular disorders or conditions such as benign paroxysmal positional vertigo (BPPV) or Menière’s disease.
As medical data collection and storage systems continue to advance, the utilization of big data analytics in healthcare research has gained momentum [4]. Big data offers unprecedented opportunities to investigate and comprehend complex medical conditions such as AVN [5]. By aggregating and analyzing vast amounts of patient data, researchers can uncover valuable insights into the prevalence, risk factors, and clinical characteristics of AVN, facilitating more informed medical decision-making and improved patient care. However, the initial issue of analyzing the big data is “operational definition of the medical term in the big health data” [6].
When you define ‘hypertension,’ there is no well-defined operational definition for hypertension in the big health data. Some might diagnose hypertension based on a single high blood pressure reading, while others might require multiple elevated readings over time. This lack of consistency leads to data ambiguity and introduces variability in the reported prevalence of hypertension. As a result, when conducting a prevalence study on hypertension using big data, researchers would encounter challenges in comparing data from different hospitals or time periods [7]. The lack of a standardized operational definition hampers the ability to accurately estimate the prevalence and draw meaningful conclusions about the condition’s distribution and trends.
In the absence of a clear operational definition, the identification of AVN cases can be inconsistent and subjective. For instance, different healthcare facilities might adopt varying diagnostic criteria or terminologies for similar vestibular disorders, leading to a lack of standardized data collection. As a consequence, some cases might be misclassified, while others might be excluded altogether. This inconsistency can introduce bias and inaccuracies into the prevalence estimation, rendering the results unreliable and hindering cross-study comparisons.
The Health Insurance Review and Assessment Service (HIRA) data includes the entire population of South Korea, as 97% of South Koreans have health insurance. We will delve into the methodology employed to create a robust operational definition for AVN within HIRA. We will compare the prevalence of AVN according to the operational definition. By emphasizing the significance of a well-defined operational definition, we aim to underscore the crucial role it plays in enhancing the accuracy and reliability of our prevalence estimation for AVNs.
MATERIALS AND METHODS
The study was authorized by the Institutional Review Board of Ulsan University Hospital (No. UUH 2023-07-030). This study was performed in accordance with the Declaration of Helsinki and written informed consent was waived due to its retrospective nature.
1. Study Population and Data Collection
The present study employed the National Patients Sample (NPS) dataset obtained from the HIRA of the Republic of Korea. HIRA is an authoritative institution responsible for overseeing the National Health Insurance program in Korea. This program provides coverage to around 98% of the country’s population. Thus, the HIRA possesses a comprehensive database that encompasses the healthcare utilization patterns of the Korean populace. The HIRA database encompasses many types of data, including personal information, health insurance prescription information, diagnosis codes based on the International Classification of Diseases, 10th Revision (ICD-10), and medication details. The NPS of the HIRA comprises a representative sample of data obtained from the HIRA database. This dataset encompasses approximately 2% of the total Korean population, equating to around 1 million individuals. The present study employed the HIRA-NPS dataset spanning the years 2009 to 2016. A chi-square test was conducted for each group, and statistical analyses were carried out using SAS ver. 9.4 (SAS Institute Inc.).
2. Operational Definitions
The initiation of this study was motivated by the need to define a suitable operational definition for the retrospective examination of AVN. The HIRA data provided us with access to information pertaining to diagnosis, testing, and drugs. The ICD-10 includes specific codes for the diagnosis of AVN. These codes are H81.2, H81.8, and H81.9. Patients with this code as their main diagnosis are eligible, and no exceptions are considered. A diagnostic assessment was contemplated in cases when two or three distinct diagnoses were observed over a span of one month. Patients with AVN may undergo many diagnostic tests, such as the caloric test, bedside head impulse test (HIT), and video HIT. Patients with AVN may be prescribed several medications, such as antihistamines, benzodiazepines, antiemetics, and steroids. In instances involving tests and medications, any instance of prescription history subsequent to the initial diagnosis date was deemed eligible for inclusion. We proceeded to identify suitable patients with AVN based on each unique combination of relevant information. The revised categorization scheme for AVN is presented as case 1 through case 5, as seen in Fig. 1.
1) Detail the criteria for each category
Case 1: Diagnosis code (H81.2, H81.8, or H81.9) recorded in clinic, occurring 2 or 3 times within 1 month (case 1-1, 2 times; case 1-2, 3 times).
Case 2: Diagnosis code along with medication (antihistamine, antiemetic, steroids, and benzodiazepine) recorded in clinic.
Case 3: Diagnosis code along with evidence of vertigo test, specifically caloric test.
Case 4: Combination of case 2 and case 3 meeting criteria of case 1.
Case 5: Either case 2 or case 3 meeting criteria of case 1.
RESULTS
1. Prevalence Estimates for Each Acute Vestibular Neuritis Category (Cases 1 to 5)
Table 1 displays the prevalence rates per 100,000 individuals per year for each respective case. The analysis focused on determining the frequency of AVN by utilizing the newly established classifications of case 1 to case 5. The process of diagnosis is a universally applied criterion in all circumstances. This study aims to compare the diagnostic considerations of case 1 with those of other cases. In case 1, the incidence of AVN diagnosis consistently increased, irrespective of whether it occurred two or three times during 1 month. In case 2, the administration of medication was reported by over 90% of patients in all years. In case 3, the caloric test was utilized as a criterion, with a prescription being issued to less than 10% of patients throughout all years. Case 4 represents the convergence of case 2 and case 3, displaying a comparable pattern to case 3 as a result of inadequate calibration of the caloric test. In contrast, case 5, comprising the combination of case 2 and case 3, exhibits a comparable trend to case 2, mostly attributable to the administration of medication at a rate exceeding 90%. In the year 2016, the prevalence estimates for avascular necrosis (AVN) in case 1 and case 5 were determined to be 3.422 and 2.949 per 100,000 individuals, respectively.
We conducted an analysis on cases 1-1 and 1-2, with the objective of including patients who received a diagnosis on two occasions, as well as those who received a diagnosis three times within a single month. In contrast, case 1-2 has a higher rate of patient exclusion when compared to case 1-1. This statement is applicable to cases 2 through 5. While the impact of the caloric test may be modest, it does have a favorable outcome in terms of identifying patients with confirmed AVN. Moreover, despite the significant impact of medicine, there exist individuals who are not prescribed pharmaceutical interventions. Hence, the optimal conditions are deemed to be those that encompass the outcomes of both case 5 and case 1-1, thereby encompassing all conditions. As a result of the frequency test between case 1-1 and case 5, there was a statistically significant difference in the patient frequency in each year (p<0.0001).
2. Subgroup Analysis
We provide prevalence estimates for subgroups (case 1 and case 5) based on demographic factors (age, sex). We conducted a comparative analysis of the patient populations in case 1 and case 5, focusing on the distribution of individuals across different sex and age groups. There was a statistically significant difference observed between case 1 and case 5 in males. This assertion is true for female as well. The age groups range from individuals under 19 years old to those over 80 years old, with each group spanning a 10-year interval. A disparity in patient numbers was seen between the groups when comparing case 1 and case 5. In addition, there were statistically significant variations seen across the following age groups: under 19 years, 30–39 years, 40–49 years, and 50–59 years. Significant statistical differences were seen among the young age groups, with the exception of the 20–29 age group, as indicated in Table 2.
Fig. 2 depicts a graphical representation of the data presented in Table 2. The number of female patients exceeds that of male patients, with a more pronounced increase. However, the upward trend from 2009 to 2012 and maintained thereafter shows the same trend. Case 1 exhibits consistently greater magnitudes overall years compared to case 5, as depicted in Fig. 2A. With the exception of the over-80-year age group, all other older age groups (namely, those over 50 years old) reported a consistent upward trend in their respective numbers. In contrast, it has been verified that a particular age group of relatively young individuals exhibited a consistent numerical value (Fig. 2B). When comparing case 1 and case 5, it is observed that the disparity between the two groups exhibits a consistent pattern throughout all years, sex, and age.
We present prevalence estimates for each medication. Our investigation encompasses four medications: namely histamine, steroid, antiemetic, and benzodiazepine. In case 2, it was found that over 90% of patients diagnosed with AVN were administered one of the four medications (Table 3).
The calculation of AVN patients was performed using the operational definition outlined in case 1-1. A limited number of individuals were prescribed antiemetics. Approximately 70% of patients were provided histamine and benzodiazepine. The prescription rate for steroids is approximately 50%.
Case 2 was substantiated by the categorization of four medications across all classifications, resulting in a prescription rate of 90%. Histamine is consistently prescribed at a rate over 80% throughout all years, indicating a stable pattern of usage. The utilization of benzodiazepine prescriptions has exhibited a decline from an initial rate of 70% to a subsequent rate of 65%, thereby substantiating a reduction in overall usage. Specifically, in the context of steroid usage, it is noteworthy that half of the participants were administered steroids while the remaining participants were not, thereby yielding an intriguing outcome.
DISCUSSION
In the realm of statistics and big data analysis, an operational definition is pivotal for maintaining consistency, reliability, and accuracy in identifying and categorizing variables or conditions. The prevalence estimates obtained from the analysis of AVN in case 1 and case 5 are of particular interest due to their similarity to the reference prevalence of 3.5 per 100,000 people reported in reliable analyses from other countries [3]. This resemblance suggests that the operational definitions employed in this study effectively captured cases of AVN, leading to prevalence estimates that align with existing data.
The establishment of a well-defined operational definition is of paramount significance when analyzing the prevalence of AVN within the HIRA dataset. In this study, AVN is operationally defined as individuals aged 18 to 65 years with at least one medical claim or diagnosis code for AVN (ICD-10 codes H81.2, H81.8, H81.9) recorded in outpatient clinics or hospitals during the calendar year 2016. To ensure diagnostic consistency, a temporal criterion mandates the presence of a minimum of two claims or diagnoses related to AVN within a 30-day period [5]. Additionally, cases with concurrent diagnoses of Menière’s disease or BPPV are excluded to ensure specificity to AVN. This carefully constructed operational definition serves as the cornerstone of our study, guiding the accurate identification and categorization of AVN cases within the HIRA data [6]. By providing a standardized framework for case identification, the operational definition reduces the risk of misclassification, enhances data integrity, and enables cross-study comparisons. Furthermore, it ensures that the identified cases closely align with the clinical characteristics of AVN, bolstering the clinical relevance of our findings for healthcare practitioners and policymakers.
The fact that both case 1 and case 5 prevalence estimates closely mirror the reference prevalence is encouraging for several reasons. Firstly, it speaks to the consistency and validity of the operational definitions used in this study. By requiring multiple diagnoses within a short timeframe (case 1) or allowing either a diagnosis or a positive vertigo test (case 5), the definitions ensure that identified cases are consistent with the condition’s clinical profile. Secondly, the agreement between the study’s prevalence estimates and the reference [3] prevalence from other countries emphasizes the robustness of the data used in the analysis. Despite potential variations in healthcare practices, diagnostic criteria, and data recording, the similarity in prevalence estimates indicates that the big data source used in this study captures a representative sample of AVN cases.
Conversely, our data source has several problems. In our results, for example, there were more female AVN patients each year. These results held across all age groups (Supplementary Table 1). Past studies have shown no sex differences in AVN [8]. We suspect a diagnostic error, such as some other diseases such as vestibular migraine being diagnosed as AVN. Alternatively, it may reflect the characteristics of South Korea, where access to medical care differs depending on sex. Medical use in Korea is increasing every year, especially due to rapid aging. The increasing number of patients with AVN is thought to be influenced by these reasons. This is a limitation of HIRA data, which uses information from each physician’s already diagnosed diagnosis. If the health insurance data had additional information such as the patient’s symptoms and duration, issues such as diagnostic errors could be ruled out. However, there is no such information in health insurance data, which is retrospective data. These errors suggest that the AVN patients in our study may have been overestimated or underestimated.
Considering this, with a meticulously crafted operational definition, researchers can establish a standardized set of criteria for identifying AVN cases within big data [9]. For instance, the operational definition could specify the required clinical symptoms, diagnostic tests, and duration of symptoms needed for a case to be classified as AVN. This clarity ensures that all cases meeting the predefined criteria are consistently identified, regardless of the healthcare facility or data source. As a result, the prevalence estimation becomes more robust, and the findings become more trustworthy and generalizable.
The operational definition in statistics, especially in the context of big data, serves as a precise and standardized criterion for identifying and categorizing specific phenomena, variables, or conditions [10]. It is of paramount importance because it ensures consistency, replicability, and accuracy in data analysis, allowing researchers to draw meaningful and reliable conclusions [11]. An operational definition provides a clear framework for data collection, ensuring that the same criteria are applied uniformly across various sources, settings, and time periods [12,13].
The findings of this study provide valuable insights into the prevalence of AVN using big data analysis. The close agreement between prevalence estimates in case 1 and case 5 with the reference prevalence reinforces the significance of welldefined operational definitions and emphasizes the reliability of the analysis. These results contribute to the broader understanding of AVN’s prevalence and underscore the potential of big data in healthcare research.
ARTICLE INFORMATION
-
CONFLICT OF INTEREST
Ji-Yun Park is the Editor-in-Chief and Young Jun Seo is the Associate Editor of Research in Vestibular Science. They were not involved in the review process of this article. All authors have no other conflicts of interest to declare.
-
FUNDING/SUPPORT
This work was supported by the Ulsan University Hospital Research Grant (UUH-2023-08).
-
AUTHOR CONTRIBUTIONS
Conceptualization, Funding acquisition: YJS, JYP; Data curation, Formal analysis, Investigation, Project administration, Resources, Software, Supervision, Validation, Visualization: CYY, SGH; Methodology, Writing–Original Draft: CYY, YJS; Writing–Review & Editing: all authors.
All authors read and approved the final manuscript.
SUPPLEMENTARY MATERIALS
Supplementary Table 1 can be found via https://doi.org/10.21790/rvs.2023.22.3.68/
Fig. 1.Operational definition of acute vestibular neuritis in each case.

Fig. 2.Number of AVN patients according to demographic factors. (A) Number of AVN patients by sex for each case. (B) Number of AVN patients by age for each case. AVN, acute vestibular neuritis.
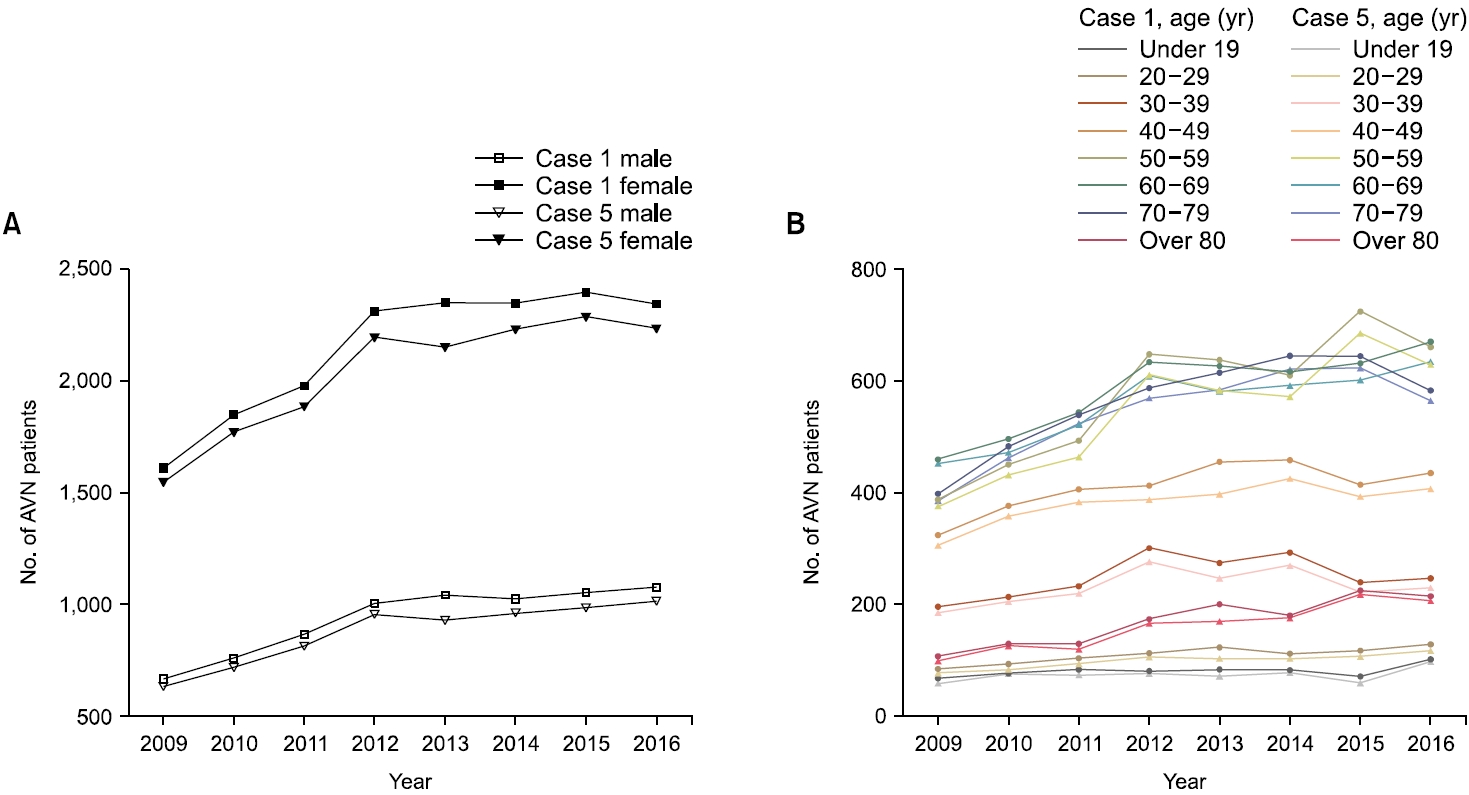
Table 1.Distribution of patients/100,000 with acute vestibular neuritis by each case
|
Case |
Year
|
|
2009 |
2010 |
2011 |
2012 |
2013 |
2014 |
2015 |
2016 |
|
Case 1-1 |
|
|
|
|
|
|
|
|
|
Case 1 |
Diagnosis |
2.277 |
2.609 |
2.847 |
3.32 |
3.392 |
3.373 |
3.452 |
3.422 |
|
Case 2 |
Medicine |
2.180 |
2.492 |
2.699 |
3.153 |
3.080 |
3.192 |
3.274 |
3.251 |
|
% |
95.74 |
95.52 |
94.80 |
94.97 |
90.79 |
94.63 |
94.84 |
95.00 |
|
Case 3 |
Caloric test |
0.224 |
0.216 |
0.190 |
0.263 |
0.255 |
0.298 |
0.267 |
0.295 |
|
% |
9.84 |
8.28 |
6.67 |
7.92 |
7.50 |
8.83 |
7.73 |
8.62 |
|
Case 4 |
Medicine and caloric test |
0.214 |
0.210 |
0.182 |
0.251 |
0.241 |
0.282 |
0.248 |
0.282 |
|
% |
9.40 |
8.05 |
6.39 |
7.56 |
7.10 |
8.36 |
7.18 |
8.24 |
|
Case 5 |
Medicine or caloric test |
2.180 |
2.492 |
2.699 |
3.153 |
3.080 |
3.192 |
3.274 |
3.251 |
|
% |
95.74 |
95.52 |
94.80 |
94.97 |
90.79 |
94.63 |
94.84 |
95.00 |
|
Case 1-2 |
|
|
|
|
|
|
|
|
|
Case 1 |
Diagnosis |
0.915 |
0.978 |
1.113 |
1.315 |
1.303 |
1.256 |
1.350 |
1.261 |
|
Case 2 |
Medicine |
0.892 |
0.929 |
1.066 |
1.251 |
1.202 |
1.200 |
1.293 |
1.199 |
|
% |
97.49 |
94.99 |
95.78 |
95.13 |
92.29 |
95.54 |
95.78 |
95.08 |
|
Case 3 |
Caloric test |
0.109 |
0.096 |
0.080 |
0.123 |
0.119 |
0.136 |
0.136 |
0.150 |
|
% |
11.91 |
9.82 |
7.19 |
9.35 |
9.11 |
10.83 |
10.07 |
11.90 |
|
Case 4 |
Medicine and caloric test |
0.106 |
0.093 |
0.078 |
0.118 |
0.115 |
0.133 |
0.129 |
0.142 |
|
% |
11.58 |
9.51 |
7.01 |
8.97 |
8.79 |
10.59 |
9.56 |
11.26 |
|
Case 5 |
Medicine or caloric test |
0.892 |
0.929 |
1.066 |
1.251 |
1.202 |
1.200 |
1.293 |
1.199 |
|
% |
97.49 |
94.99 |
95.78 |
95.13 |
92.29 |
95.54 |
95.78 |
95.08 |
Table 2.Demographic information on acute vestibular neuritis patients by case from 2009 to 2016 in Korea
|
Case |
Year
|
|
2009 |
2010 |
2011 |
2012 |
2013 |
2014 |
2015 |
2016 |
Total |
p-value |
|
Sex |
|
|
|
|
|
|
|
|
|
|
|
Male |
1 |
665 (2.69) |
759 (3.07) |
868 (3.52) |
1,007 (4.08) |
1,042 (4.22) |
1,025 (4.15) |
1,054 (4.27) |
1,077 (4.36) |
7,497 (30.36) |
<0.001 |
|
5 |
632 (2.79) |
719 (3.17) |
813 (3.58) |
956 (4.21) |
929 (4.09) |
959 (4.23) |
986 (4.35) |
1,014 (4.47) |
6,840 (30.16) |
|
|
Female |
1 |
1,612 (6.53) |
1,850 (7.49) |
1,979 (8.01) |
2,313 (9.37) |
2,350 (9.52) |
2,348 (9.51) |
2,398 (9.71) |
2,345 (9.50) |
17,195 (69.64) |
<0.001 |
|
5 |
1,548 (6.83) |
1,773 (7.82) |
1,886 (8.32) |
2,197 (9.69) |
2,151 (9.48) |
2,233 (9.85) |
2,288 (10.09) |
2,237 (9.86) |
15,841 (69.84) |
|
|
Age (yr) |
|
|
|
|
|
|
|
|
|
|
|
Under 19 |
1 |
76(0.31) |
87 (0.35) |
94 (0.38) |
91 (0.37) |
94 (0.38) |
93 (0.38) |
80 (0.32) |
114 (0.46) |
729 (2.95) |
<0.001 |
|
5 |
66 (0.29) |
85 (0.37) |
83 (0.37) |
86 (0.38) |
81(0.36) |
88 (0.39) |
67 (0.30) |
110 (0.48) |
617 (2.72) |
|
|
20–29 |
1 |
95 (0.38) |
105 (0.43) |
117 (0.47) |
127 (0.51) |
139 (0.56) |
126 (0.51) |
132 (0.53) |
145 (0.59) |
986 (3.99) |
0.123 |
|
5 |
87 (0.38) |
94 (0.41) |
106 (0.47) |
120 (0.53) |
115.5 (0.51) |
116 (0.51) |
120 (0.53) |
132 (0.58) |
852 (3.76) |
|
|
30–39 |
1 |
220 (0.89) |
240 (0.97) |
262 (1.06) |
339 (1.37) |
309 (1.25) |
330 (1.34) |
270 (1.09) |
278 (1.13) |
2,248 (9.10) |
0.015 |
|
5 |
208 (0.92) |
231 (1.02) |
247 (1.09) |
311 (1.37) |
278 (1.23) |
304 (1.34) |
250 (1.10) |
259 (1.14) |
2,003 (8.83) |
|
|
40–49 |
1 |
364 (1.47) |
423 (1.71) |
457 (1.85) |
464 (1.88) |
512 (2.07) |
516 (2.09) |
465 (1.88) |
489 (1.98) |
3,690 (14.94) |
0.001 |
|
5 |
344 (1.52) |
403 (1.78) |
431 (1.90) |
436 (1.92) |
447 (1.97) |
479 (2.11) |
442 (1.95) |
459 (2.02) |
3,329 (14.68) |
|
|
50–59 |
1 |
436 (1.77) |
507 (2.05) |
554 (2.24) |
729 (2.95) |
717 (2.90) |
686 (2.78) |
816 (3.30) |
745 (3.02) |
5,190 (21.02) |
0.022 |
|
5 |
422 (1.86) |
486 (2.14) |
522 (2.30) |
688 (3.03) |
656 (2.89) |
643 (2.83) |
771 (3.40) |
709 (3.13) |
4,773 (21.04) |
|
|
60–69 |
1 |
517 (2.09) |
558 (2.26) |
611 (2.47) |
713 (2.89) |
705 (2.86) |
693 (2.81) |
711 (2.88) |
753 (3.05) |
5,261 (21.31) |
0.107 |
|
5 |
509 (2.24) |
531 (2.34) |
586 (2.58) |
685 (3.02) |
653.5 (2.88) |
666 (2.94) |
677 (2.98) |
714 (3.15) |
4,918 (21.68) |
|
|
70–79 |
1 |
448 (1.81) |
543 (2.2) |
606 (2.45) |
661 (2.68) |
691 (2.80) |
726 (2.94) |
725 (2.94) |
656 (2.66) |
5,056 (20.48) |
0.236 |
|
5 |
433 (1.91) |
520 (2.29) |
589 (2.60) |
640 (2.82) |
657.25 (2.90) |
698 (3.08) |
702 (3.10) |
635 (2.80) |
4,772 (21.04) |
|
|
Over 80 |
1 |
121 (0.49) |
146 (0.59) |
146 (0.59) |
196 (0.79) |
225 (0.91) |
203 (0.82) |
253 (1.02) |
242 (0.98) |
1,532 (6.20) |
0.560 |
|
5 |
111 (0.49) |
142 (0.63) |
135 (0.60) |
187 (0.82) |
191.25 (0.84) |
198 (0.87) |
245 (1.08) |
233 (1.03) |
1,417 (6.25) |
|
Table 3.Distribution of patients/100,000 prescribed at least once since initial diagnosis of each medicine
|
Year |
Histamine |
Steroid |
Antiemetic |
Benzodiazepine |
All types |
Case 1-1 |
|
2009 |
1.982 (87.04) |
0.897 (39.39) |
0.003 (0.13) |
1.619 (71.10) |
2.180 (95.74) |
2.277 |
|
2010 |
2.242 (85.93) |
1.065 (40.82) |
0.009 (0.34) |
1.842 (70.60) |
2.492 (95.52) |
2.609 |
|
2011 |
2.423 (85.11) |
1.188 (41.73) |
0.006 (0.21) |
2.009 (70.57) |
2.699 (94.80) |
2.847 |
|
2012 |
2.800 (84.34) |
1.435 (43.22) |
0.019 (0.57) |
2.324 (70.00) |
3.153 (94.97) |
3.320 |
|
2013 |
2.770 (81.66) |
1.483 (43.72) |
0.021 (0.62) |
2.233 (65.83) |
3.080 (90.80) |
3.392 |
|
2014 |
2.890 (85.68) |
1.627 (48.24) |
0.023 (0.68) |
2.275 (67.45) |
3.192 (94.63) |
3.373 |
|
2015 |
2.968 (85.98) |
1.680 (48.67) |
0.036 (1.04) |
2.324 (67.32) |
3.274 (94.84) |
3.452 |
|
2016 |
2.949 (86.18) |
1.485 (43.40) |
0.011 (0.32) |
2.230 (65.17) |
3.251 (95.00) |
3.422 |
REFERENCES
- 1. Ahn SH, Shin JE, Kim CH. Final diagnosis of patients with clinically suspected vestibular neuritis showing normal caloric response. J Clin Neurosci 2017;41:107–10.ArticlePubMed
- 2. Choi JW, Kang SI, Rhee JH, Choi BY, Kim JS, Koo JW. Clinical implication of ocular torsion in peripheral vestibulopathy. Eur Arch Otorhinolaryngol 2015;272:1613–7.ArticlePubMedPDF
- 3. Strupp M, Brandt T. Vestibular neuritis. Semin Neurol 2009;29:509–19.ArticlePubMed
- 4. Lee HJ, Lee J, Yoon C, Park Y, Joo YH, Park JO, et al. Association of dietary factors with noise-induced hearing loss in Korean population: a 3-year national cohort study. PLoS One 2022;17:e0279884. ArticlePubMedPMC
- 5. Yoon CY, Kong TH, Lee J, Seo YJ, Ahn JJ. Epidemiology of idiopathic sudden sensorineural hearing loss in the era of big data. Eur Arch Otorhinolaryngol 2023;280:2181–90.ArticlePubMedPDF
- 6. Lee J, Lee JH, Yoon C, Kwak C, Ahn JJ, Kong TH, et al. Relationship between Nutrient Intake and Hearing Loss According to the Income Level of Working-Aged Adults: A Korean National Health and Nutrition Survey. Nutrients 2022;14:1655. ArticlePubMedPMC
- 7. Seo YJ, Park YA, Kong TH, Bae MR, Kim SH. Head position and increased head velocity to optimize video head impulse test sensitivity. Eur Arch Otorhinolaryngol 2016;273:3595–602.ArticlePubMedPDF
- 8. Haeussler SM, Zabaneh SI, Stegemann M, Olze H, Böttcher A, Stölzel K. Is vestibular neuropathy rather a neuritis? Cureus 2022;14:e29959. ArticlePubMedPMC
- 9. Kim CH, Shin JE, Yoo MH, Park HJ. Direction-changing and direction-fixed positional nystagmus in patients with vestibular neuritis and Meniere disease. Clin Exp Otorhinolaryngol 2019;12:255–60.ArticlePubMedPMCPDF
- 10. Pogson JM, Taylor RL, Young AS, McGarvie LA, Flanagan S, Halmagyi GM, et al. Vertigo with sudden hearing loss: audio-vestibular characteristics. J Neurol 2016;263:2086–96.ArticlePubMedPDF
- 11. Strupp M, Bisdorff A, Furman J, Hornibrook J, Jahn K, Maire R, et al. Acute unilateral vestibulopathy/vestibular neuritis: diagnostic criteria. J Vestib Res 2022;32:389–406.ArticlePubMedPMC
- 12. Uffer DS, Hegemann SC. About the pathophysiology of acute unilateral vestibular deficit: vestibular neuritis (VN) or peripheral vestibulopathy (PVP)? J Vestib Res 2016;26:311–7.ArticlePubMed
- 13. Yang YJ, Choi JE, Kim MT, Kim SH, Lee MY, Yoo DS, et al. Measurement of horizontal ocular deviation on magnetic resonance imaging in various disease with acute vertigo. PLoS One 2019;14:e0224605. ArticlePubMedPMC
Citations
Citations to this article as recorded by


 , 서영준1,3
 PubReader
 ePub Link
 Cite
Cite


