Skip Navigation
Skip to contents

Res Vestib Sci : Research in Vestibular Science

OPEN ACCESS
SEARCH
Search

Articles

Page Path
HOME > Res Vestib Sci > Volume 17(4); 2018 > Article
Original Article
급성저혈압에 의한 내측전정신경핵 신경세포의 흥분성 변화를 분석하기 위한 테트로드 기법의 적용
김영1, 구호2,3, 박병림3, 문세진3, 양승범4, 김민선3orcid
Application of Tetrode Technology for Analysis of Changes in Neural Excitability of Medial Vestibular Nucleus by Acute Arterial Hypotension
Young Kim1, Ho Koo2,3, Byung Rim Park3, Se Jin Moon3, Seung-Bum Yang4, Min Sun Kim3orcid
Research in Vestibular Science 2018;17(4):142-151.
DOI: https://doi.org/10.21790/rvs.2018.17.4.142
Published online: December 21, 2018

1Department of Emergency Medicine, Wonkwang University School of Medicine & Hospital, Iksan, Korea

2Institute of Brain Science, Wonkwang University School of Medicine, Iksan, Korea

3Department of Physiology, Wonkwang University School of Medicine, Iksan, Korea

4Department of Medical Non-commissioned Officer, Wonkwang Health Science University, Iksan, Korea

Corresponding Author: Min Sun Kim Department of Physiology, Wonkwang University School of Medicine, 460 Iksan dae-ro, Iksan 54538, Korea Tel: +82-63-850-6779 Fax: +82-63-852-6108 E-mail: mskim@wku.ac.kr
• Received: September 16, 2018   • Revised: October 24, 2018   • Accepted: October 24, 2018

Copyright © 2018 by The Korean Balance Society. All rights reserved.

This is an open access article distributed under the terms of the Creative Commons Attribution Non-Commercial License (http://creativecommons.org/licenses/by-nc/4.0) which permits unrestricted non-commercial use, distribution, and reproduction in any medium, provided the original work is properly cited.

  • 6,027 Views
  • 53 Download
prev next
  • Objectives
    Excitability o medial vestibular nucleus (MVN) in the brainstem can be affected by changes in the arterial blood pressure. Several animal studies have demonstrated that acute hypotension results in the alteration of multiunit activities and expression of cFos protein in the MVN. In the field of extracellular electrophysiological recording, tetrode technology and spike sorting algorithms can easily identify single unit activity from multiunit activities in the brain. However, detailed properties of electrophysiological changes in single unit of the MVN during acute hypotension have been unknown.
  • Methods
    Therefore, we applied tetrode techniques and electrophysiological characterization methods to know the effect of acute hypotension on single unit activities of the MVN of rats.
  • Results
    Twoor3typesofunitcouldbeclassifiedaccordingtothemorphologyofspikes and firing properties of neurons. Acute hypotension elicited 4 types of changes in spontaneous firing of single unit in the MVN. Most of these neurons showed excitatory responses for about within 1 minute after the induction of acute hypotension and then returned to the baseline activity 10 minutes after the injection of sodium nitroprusside. There was also gradual increase in spontaneous firing in some units. In contrast small proportion of units showed rapid reduction of firing rate just after acute hypotension.
  • Conclusions
    Therefore, application of tetrode technology and spike sorting algorithms is another method for the monitoring of electrical activity of vestibular nuclear during acute hypotension.
원발성심혈관질환을 가진 환자들 중 약 10% 정도에서 주증상이거나 초기 증상으로 현훈을 경험한다[1-3]. 또한 기립어지럼 및 심장성어지럼 환자들에서 하방 안진, 회전성현훈 등이 동반되기도 한다. 이는 심혈관계 기능 이상과 함께 중추 전정기관 또는 소뇌의 기능 이상이 초래될 수 있음을 시사한다[4,5].
한편, 이 논문 저자들의 과거 연구에서, 내측전정신경핵에서 급성저혈압유발 시 신경세포의 흥분성 표지자인 cFos 및 pERK1/2 단백이 발현됨을 확인했고, 이때 말초 전정 수용체의 흥분이 전정신경핵의 흥분성 변화의 선행 조건임을 보고하였다[6,7]. 이는 혈압 변동에 의해 중추 전정신경핵의 흥분성이 변화될 수 있음을 제시하는 소견으로, 다른 연구자들은 급성저혈압유발 동안 내측전정신경핵 신경세포들의 자발발화성의 변화를 보고하기도 하였다[8].
세포외 전기생리 기록법(extracellular electrophysiological recording technique)은 중추신경계 신경세포들의 전기활동성을 측정하는 기법들 중의 하나로, 기록 전극을 신경세포의 세포체에 밀착시켜 신경세포의 활동전위의 파형(spike)을 검출한다. 전정신경핵에서 신경세포의 흥분성 측정을 위한 대부분의 세포외 전기생리 기록법에서는 유리전극 또는 텅스텐과 같은 금속 전극 1개만 사용하였다. 이때 이들 기록전극의 끝단이 2‒5 μm 직경으로 신경세포의 세포체에 기록전극이 근접하는 것이 용이하다.
4개의 미세 금속전선을 서로 밀접하게 꼬아서 하나의 결합체 형태로 제작한 전극을 테트로드 전극(tetrode electrode)이라고 하는데, 세포외 전기생리 기록법에서 기록전극으로 이를 사용하면 하나의 신경세포에서 유래된 spike를, 인접한 4개의 미세전극에서 기록할 수 있다[9]. 이 때, 4개의 미세전극과 신경세포 사이의 공간적 차이가 있기 때문에 4개의 미세전극에서 기록되는 spike의 파형 모양 및 진폭이 다르게 기록된다[10].
테트로드 전극을 사용한 세포외 전기생리 기록법을 이용한다면, 하나의 신경세포에서 발생한 spike를 4개의 전극에서 비교 분석할 수 있어 인접 신경세포들에서 동시에 발행하는 여러 형태의 spike를 비교 분석하는데 유용하다. 이때, 통계학적 기법을 적용한 spike 분류 알고리즘(sorting algorithms)과 단일 spike 파형 및 자발 발화 특성을 자동으로 분석하는 소프트웨어를 사용한다면 단일 spike의 전기생리학적 특징에 따른 신경세포의 분류도 가능하다[11]. 이러한 장점 때문에, 따라서 테트로드전극을 사용한 세포외 전기생리 기록법은 대뇌피질, 해마, 소뇌 등 다양한 뇌 영역에서 신경세포의 전기적 신호 정보를 획득, 분석하는 데 필수적으로 사용되고 있다[12,13].
그러나, 저자들이 아는 한, 이러한 기법을 이용한 전정신경핵신경세포에서 spike의 검출 및 분류 과정에 대한 연구는 거의 이루어지지 않은 실정이다.
따라서 이 연구의 목적은 테트로드 전극을 사용한 세포외 전기생리 기록법을 이용하여 흰쥐의 내측전정신경핵에서 신경세포들의 spike에 대한 전기생리학적 특징을 규명하고, 급성저혈압유발 후 내측전정신경핵 신경세포들의 자발발화성의 변화를 관찰하고자 하였다.
1. 연구 대상 및 급성저혈압유발

1) 실험 동물

7마리의 체중 300‒400 g (8‒12 주령)의 성숙한 Sprague-Dawley계 흰쥐를 암수 구분 없이 사용하였다. 실험 7일 전부터 실험실 환경에 적응시켜 환경 변화에 따른 영향을 최소화하였다. 각 실험 동물을 대상으로, 정상 말초전정기능을 확인하기 위해, 회전 자극을 이용한 전정기능검사를 실시하였다[6]. 이 연구의 모든 실험 절차들은 원광대학교 동물생명윤리 위원회의 승인 아래 진행되었다.

2) 혈압측정 및 저혈압유발

실험 동물을 urethane을 0.9% 생리식염수에 20% 농도로 희석시켜 복강 내 주사(1.5 g/kg) 하여 마취시킨 후, 앙와위로 실험대에 고정하였다[6]. 수술현미경하에서 일측대퇴동맥을 박리, 분리한 후 폴리에틸렌 관(polyethylene tube)을 대퇴동맥에 삽입하였다. 삽입된 관을 압력변환기(pressure transducer; Gould Inc., Holliston, MA, USA)에 연결하고, 다시 압력변화기를 생리기록기(physiograph; Grass Inc., West Warwick, RI, USA) 연결하여 혈압을 측정하였다. 측정된 혈압 수치는 개인용 컴퓨터(Spike2, Cambridge Electronic Design Ltd., Cambridge, UK)에 저장하였다. 저혈압을 유도하기 위해, 폴리에틸렌 관을 통해, sodium nitroprusside (SNP)을 주입하였다. 이때 정상 혈압 대비 30% 정도 하강을 목표로, SNP 농도(10 μg/kg)를 정하였다[6]. 모든 실험과정 동안 실험 동물의 체온을 직장체온 37.5°C로 유지하기 위하여 자체 제작한 체온조절기와 전기 담요(Fine Scientific Tool, Sequim, WA, USA)를 사용하였다.
2. 테트로드 전극제작
Spike를 기록하기 위한 테트로드 전극 제작을 위해, Polyamide로 코팅된 니크롬 전극(nichrome; 직경 16 μm, A-M System, Foster, CA, USA)을 5 cm길이 간격으로 4 가닥으로 겹쳐 제작하였다. 4 가닥의 니크롬선을 자체 제작한 테트로드회전기에 고정한 다음 30 회 회전하여 4 가닥 니크롬 전극을 서로 강하게 꼬아 전극들이 서로 잘 접착되도록 하였다. 소형 열풍기를 이용하여 꼬인 4 가닥의 전극에 200°C 정도의 열을 가하여 전극들이 서로 접착되도록 하였다. 테트로드를 자체 제작한 PCB전극 프로브에 고정하고 테트로드의 일측 니크롬 전극 끝 부분의 피복을 벗긴 다음 PCP전극 프로브의 전극 연결부에 납땜하여 고정하였다. 신경세포가 접촉하는 반대측테트로드 끝단을 미세강철가위로 절단한 다음 10% 금(gold) 용액(Neuralynx, Ann Arbor, MI, USA)에 삽입하고, 전기자극기(electrical stimulator, A310 Accupulser, WPI, Sarasota, FL, USA)에 전극프로브를 연결한 다음 미세전류 2 μA를 2–10 초간 통전하여 테트로드의 니크롬선 끝단을 금으로 도금하여 니크롬 전극의 저항값을 늦추었다. 임피던스 기록계(IMP-2A, Bak Electronics Inc., Umatilla, FL, USA)를 이용하여 도금된 개별 니크롬 전극의 저항을 측정하여 저항이 300–500 KOhm (1 kHz)사이를 유지되는지 확인하였다[14]. 동시에 두 개의 테트로드 전극으로부터 신경신호를 측정하기 위하여 완성된 두 개의 테드로드 전극을 27 게이지 바늘에 삽입하여 밀착시킨 후에 실험동물의 뇌에 삽입하였다.
3. 다채널 세포외 전기생리기법을 이용한 Spikes의 기록
Urethane을 이용하여 실험동물을 전신 마취 시행 후 뇌정위시술장치(SR-6R-HT, Narishige Co., Tokyo, Japan)에 실험동물의 두부를 고정시킨 후 두피를 절개하고 두개골을 노출시켰다. 전동미세드릴을 사용하여 두개골을 절단한 다음 경막을 절개하여 소뇌를 노출시켰다. 수술현미경하에서 전동 미세전동조작기(DSM-11, Narishige Co., Tokyo, Japan)를 이용하여 두 개의 테트로드 전극을 소뇌표면을 통하여 내측전정신경핵에 삽입하였다. 내측전정신경핵 내 테트로드의 삽입 위치는 정수리점에서 뒤쪽으로 7–8 mm, 옆쪽으로 1–2 mm지점이고, 깊이는 소뇌겉질 표면에서 6–7.5 mm였다[15].
16 채널의 신호증폭기(RHA2000 amplifier chips, Intan Tech, Los Angeles, CA, USA)을 사용하여 테트로드 전극에서 기록되는 신경세포들의 활동전위를 증폭하였으며 증폭된 신호는 A/D 변환기(USB interface board, Intan Tech, Los Angeles, CA, USA)를 통하여 컴퓨터에 전달되었다. 컴퓨터의 A/D 변환기 제어 프로그램을 사용하여 증폭된 전기신호를 300–3,000 Hz의 주파수 대역으로 필터하여 spike 파형의 전기적 신호만 검출하였다. 검출된 spike 신호는 다시 다른 유형의 A/D 변화기(CED 1401, CED Co., Cambridge, UK)를 경유하여 spike의 기록 및 분석이 가능한 프로그램(Spike 2, version 6, CED Co.)에 저장하였다. 이때 spike 기록 시 A/D 변환기의 샘플링 속도를 25 kHz 로 설정하여 왜곡이 일어나지 않도록 하였다. Spike를 구분하기 위하여 기저 노이즈 수준의 3배 높이의 역치값에서 spike를 기록하였다.
한편 테트로드 전극을 삽입하고 일단 spike가 관찰되면, 신경세포의 자발 활동성이 안정상태가 될 수 있도록 30분 이상 기저기록(baseline recording)을 실시하였다. 그 다음 급성저혈압유발 후 1시간 이상 신경세포의 흥분성 변화를 관찰하였다.
4. 테트로드 전극의 위치 확인
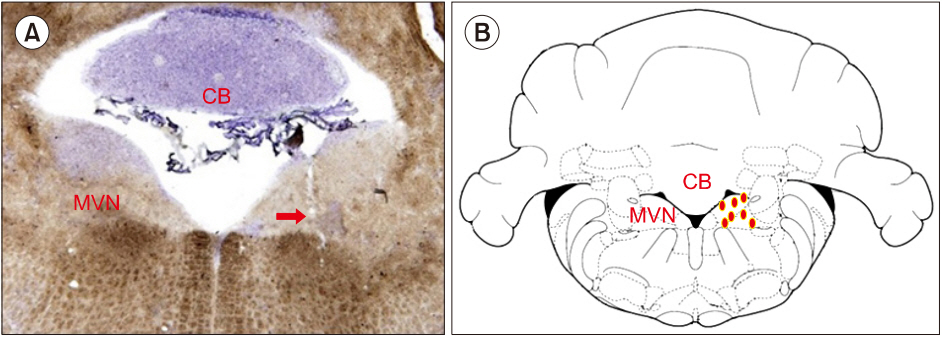
테트로드 전극의 위치를 확인하기 위하여 실험이 끝난 후 전기조직손상장치(direct constant current lesion maker, Grass Instrument, West Warwick, RI, USA)를 사용하여 테트로드 전극을 통하여 100 μA의 양극 직류전류를 20초간 통전하여 뇌조직을 손상시켜 전극의 위치를 표시하였다. 실험 동물을 깊게 마취시킨 후 심장을 통해 4% paraformaldehyde 조직고정액으로 관류시켜 뇌를 고정한 다음 적출하였다. 적출한 뇌는 다시 조직고정액에 24시간 동안 추가 고정한 다음 20% 설탕용액에 2–3일 동안 보관하였다. 동결조직절단기(HM525 NX Cryostat, ThermoFisher Sci, London, UK)를 사용하여 뇌조직을 40 μm 두께로 관상 절편을 만들고 cresyl violet으로 염색한 후 현미경(BX41, Olympus, Tokyo, Japan)을 통해 전극의 유입경로와 내측전정신경핵에서 전기손상 부위를 확인하였다(Fig. 1). 한편 조직검사에서 기록전극이 내측전정신경핵에 위치하지 않은 실험 동물의 결과는 실험 결과의 분석에서 제외하였다.
5. Spikes의 자료 분석

1) Spike 분류 및 군집화(spike sorting & clustering)

테트로드 전극에서 동시에 기록된 4개의 spike을 같은 형태로 분류하기 위하여 spike 2 프로그램의 template-matching spike sorting 알고리즘을 사용하였다. 이때 spike의 구분은 spike 진폭이 기저 노이즈 수준(S/N ratio)의 3배 이상 크기를 보이는 spike 만을 선택하였다. 또한 spike 선택을 위해 spike의 시간 범위는 spike 발생 전 0.3 msec에서 spike 후 1.0 msec 로 총 1.3 msec의 구간에서 선택한 후에, 4개의 전극에서 검출되는 spike의 유사도에 따라 2–3개의 spike로 구분하였다. 분류된 spike들은 Spike2 프로그램에 내장된 Principal Component Analysis (PCA) 알고리즘과 K-mean 방법을 사용하여 통계적으로 spike들이 일정한 형태의 spike로 분류하였다. 이후 각 단일 spike를 분리한 다음 전기생리학적 특성화 분석을 실시하였다.

2) Spike의 전기생리학적 특성화

각 spike의 전기생리학적 특성화는 spike 파형의 valley to peak time과 half-valley time을 산출하여 이들 시간과의 상관성을 통하여 spike 파형의 시간 범위를 분석하였다. 분류된 신경들의 발화 패턴을 분석하기 위해서 1 msec 간격(bin) 사이즈의 interspike interval (ISI)와 autocorrelation을 분석하였고 이를 통하여 분류된 신경 신호의 발화 특징을 비교하였다.
1. 내측전정신경핵에서 측정한 spike의 전기생리학적 특징에 따른 신경세포의 분류
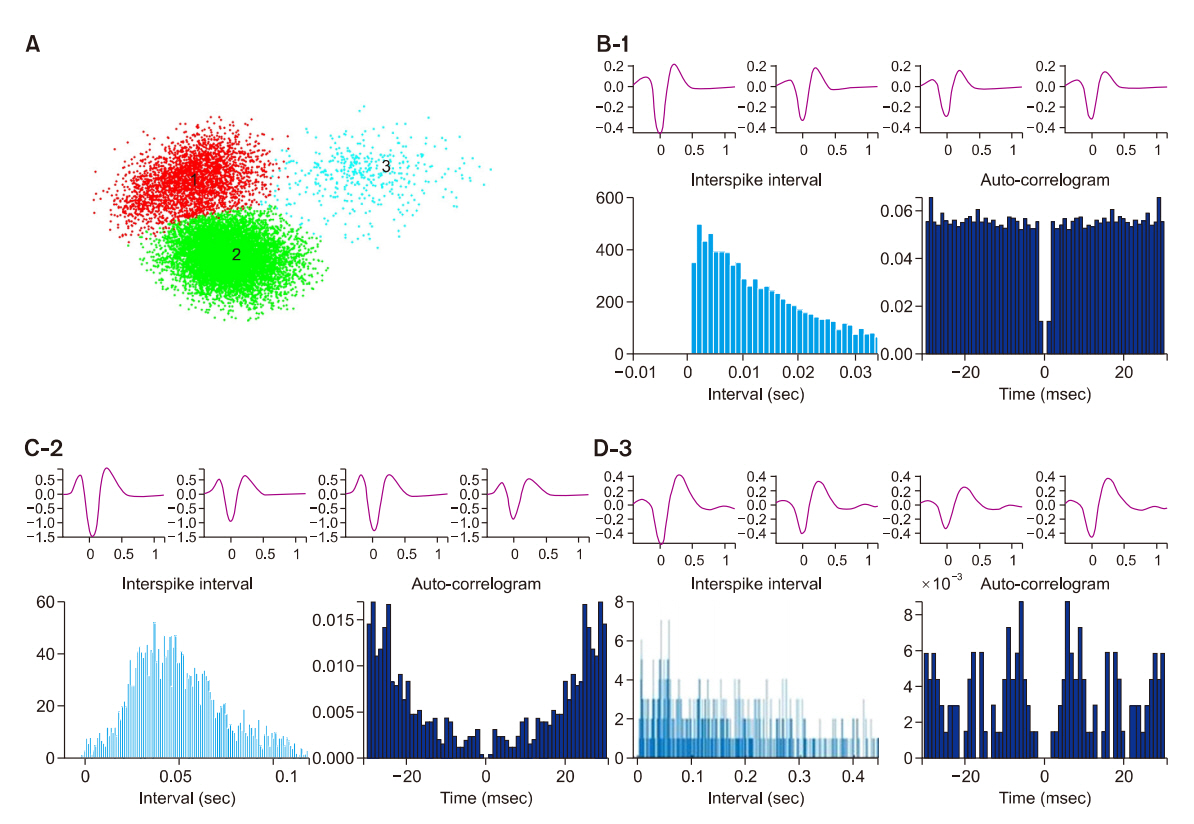
한 개 테트로드 전극에서 2–3개의 spike가 통계적으로 유의하게 분류되었다(Fig. 2A). 1번 spike의 ISI의 분포(Fig. 2B-1)가 2번(C-2), 3번 spike (D-3)의 ISI와 비교하여 한 곳에 집중되어 있었는데, 이는 1번 spike의 자발발화성이 다른 spike들에 비해 비교적 규칙적인 경향임을 시사하는 결과였다. 특히, Fig. 2D-3의 3번 spike의 경우, auto-correlogram의 분포가 ~20 msec에 집중되어 있다. 이것은 3번 spike가 약 10 msec의 spike 간 간격을 가지고 있는 버스트(Burst)의 자발발화 특성을 가지고 있음을 보여 준다. 전체적으로 1과 3번 spike 같은 경우 발화의 규칙성과 발화시점의 집중도에서 2번 spike에 비해서 보다 명확한 차이를 보였다.
총 77개의 단일 spike를 추출하여, trough-to-peak time과 half valley time을 측정하였다. 이때 trough-to-peak time은 0.2 msec에서 0.4 msec에 분포하며 평균값은 0.19 msec였다. 특히, 전체 spike의 60% 이상(n=43)이 0.2–0.3 msec 사이에 분포하였고 0.3 msec 이상에서는 분석 spike의 27% (n=21)가 분포하였다(Fig. 3B). 그리고 각 spike의 half-valley time은 0.13 msec에서 0.29 msec으로 평균값은 0.26 msec였으며 평균값을 중심으로 정규분포 형태를 보였다(Fig. 3C). 한편 trough-to-peak 기간과 half-valley 기간과의 상관성에서 trough-to-peak time이 길수록 half-valley 기간도 길어 졌으며 이때 trough-to-peak time의 0.27 msec을 기준과 half-valley 기간의 0.215 msec 기준으로 2개의 spike군으로 구분할 수 있었다(Fig. 3D).
2. 급성저혈압에 의한 내측전정신경핵 신경세포의 자발발화성의 변화
안정상태의 평균 동맥혈압은 93.3±15.6 mmHg (평균±표준편차)였다. 한편 SNP을 10 μg/kg 용량으로 투여하였을 때, 약물투여 60초 이내에 혈압이 최저로 감소하였으며 이후 빠르게 정상으로 회복되었다. 이때 SNP에 의한 최저 혈압은 65.4±9.2 mmHg (n=7)로 약물투여 전과 비교하여 약 30%의 혈압 감소를 보였다(Fig. 4A).
급성저혈압 후 내측전정신경핵 신경세포의 자발발화성의 변화를 20개의 신경세포에서 관찰하였다. 급성저혈압에 의한 내측전정신경핵의 신경세포의 자발발화성의 반응은 4 가지 형태를 보였는데, (1) 저혈압직후 자발발화성이 빠르게 증가하는 신경세포 (n=8), (2) 저혈압 직후 자발발화성이 감소하는 신경세포(n=5), (3) 저혈압유발 후 자발발화성이 점진적으로 증가하는 신경세포(n=4), 및 (4) 자발 변화가 없는 신경(n=3) 순으로 관찰되었다. 저혈압에 의한 빠른 자발발화성 증가는 저혈압 유발 30초에 최대 32% 이상의 증가를 보였으며 평균값으로 10.2%±9.4% (n=13) 이상 증가하였다(Figs. 4B, 5). 또한 일부 신경세포에서는 자발발화성이 저혈압 30초 이후에도 점차적으로 증가하는 경향을 보였다(Figs. 4, 5). 한편 저혈압유발 후 5개의 신경세포에서 자발발화성이 감소하였는데 이때 저혈압유발 30초에서 평균감소는 8.1%±3.1%을 보였다(Fig. 5).
그리고 spike 파형의 진폭이 큰 신경세포들 중에서 급성저혈압유발 후 진폭이 감소하였으며 이러한 진폭 감소는 혈압이 정상으로 회복되는 10 분 후에도 지속되는 경향을 보였다(Fig. 4C).
이 연구는 2개의 테트로드 전극과 다채널 세포외 기록장치를 이용하여 내측전정신경핵의 신경세포들의 활동전위인 spike를 기록하였다. 저자들이 아는 한, PCA 알고리즘 및 K-mean 방법을 사용하여 spike들을 분류한 첫 번째 연구로 생각한다. 또한 각 spike의 trough to peak time과 half-valley time을 측정하여 spike의 형태학적 특징을 규명하고, ISI와 auto-correlation을 분석하여 spike의 자발발화성의 특징을 확인하였다.
테트로드 전극은 하나의 신경세포의 spike를 4개의 전극에서 동시에 측정하기 때문에, 테트로드 전극과 신경세포의 위치에 따라서 4개의 전극에서 기록되는 spike 파형 모양과 크기가 달라질 수 있다. 또한 다른 위치에 있는 신경세포의 spike도 4개의 전극에서 다른 형태로 기록될 수 있어 신경세포들 간의 spike 파형과 크기를 비교 분석하는 데 많은 장점이 있다. 따라서 단일 기록전극을 이용한 세포외 전기생리 기록법 보다 각 신경세포의 spike를 보다 쉽게 감별하거나, 분리할 수 있다[9,10].
대부분의 기존 연구들에서는 단일 기록 전극을 이용하여, 전정신경핵에서 신경세포들의 자발발화성을 기록하였다[8,16-18]. 일반적으로, 진폭이 가장 큰 spike를 임의로 선정하여 일정 진폭 높이의 역치값에서 spike를 필터하여 spike의 자발발화성의 변화를 관찰하였다. 이때 문제점은 spike의 진폭은 전극과 신경세포의 거리, 신경세포의 이온채널 활성도, 및 자발발화 빈도 등에 의해 다양한 정도로 영향을 받는다는 점이다. 따라서 spike의 진폭만으로 단일 신경세포의 spike를 분류하는 것이 어려운 실정이다[19,20]. 이러한 단점 때문에 전정신경핵신경세포를 기능적으로 분류하는 방법들이 시도되었는데 주로 회전자극, 전기자극 등으로 말초 전정기관을 자극하여 전정신경핵 신경세포의 자발발화성의 변화를 유도한 다음 신경세포를 기능적으로 분류하였다[8,16,18,21]. 가장 대표적인 예로 Precht과 Shimazu [21]는 회전자극에 의하여 동측 말초전정기관의 흥분에 자발발화 빈도가 증가하는 제 I 형 신경세포와 자발발화 빈도가 감소하는 제 II 형 신경세포로 구분하기도 하였다.
이번 연구에서 하나의 테트로드 전극에서 2–3개 신경세포의 spike를 선명하게 분리할 수 있었다. 한편 대뇌피질 및 해마에서 테트로드 전극을 이용한 기록에서 1개의 테트로드 전극에서 4–7개 이상의 spike가 분리된다[9]. 이러한 연구 결과를 고려해 볼 때 이 연구에서 분리된 spike 수는 매우 작은 편이며, 이는 전정신경핵의 신경세포들 밀집도가 대뇌피질 및 해마에서보다 적은 것을 의미할 수 있다[22]. 또한, 이 연구의 결과 중 단일 spike를 파형에서 trough to peak time의 평균값은 0.19 msec였으며 60% 이상의 spike에서 0.2–0.3 msec 사이에 위치했다. 또한 half-valley time은 0.13–0.29 msec으로 평균값은 0.26 msec이었다. 기존 연구에서는, 해마 및 피질에서 흥분성 신경세포인 피라미드 세포의 trough to peak time은 0.5–0.9 msec 이고 half-valley time은 0.30.7 msec이다[23]. 억제성 신경세포의 trough to peak time 및 half-valley time은 각각 0.25–0.5 msec, 0.1–0.3 msec이었다[23]. 따라서 이러한 피질 및 해마의 결과를 고려할 때 이 연구에서 관찰한 내측전정신경핵 신경세포의 spike 파형의 간격이 피라미드 및 억제성신경세포의 파형보다 매우 좁은 형태를 보였다. 이러한 뇌 각 부위에서 관찰되는 spike 파형의 차이는 뇌의 각 영역이 가지고 있는 고유기능의 차이에 기인하는 것으로 생각한다.
이외에, 세포 내 전기생리 기록법을 이용하여 뇌간 절편의 전정신경핵 신경세포에서 활동전위의 파형을 분석하여 신경세포의 전기생리학적 특징들을 파악한 연구들이 진행되었다[24,25]. 특히 활동전위의 파형 분석을 통하여 흥분성신경세포와 억제성신경세포를 구분하기 위한 연구들이 진행되었다[26,27]. 내측전정신경핵 신경세포들은 활동전위의 파형 및 세포막의 고유한 전기특징에 따라서 3가지 유형으로 구분되는데, A형 신경세포는 긴 활동전위와 afterhyperpolarization (AHP)을 보이며, B형 신경세포는 burst 흥분 패턴을 보이면서 AHP와 afterdepolarization을 같이 동반하며, C형 신경세포는 이러한 2가지 유형에 포함되지 않은 활동전위를 보이는 세포로 구분하였다[24,25]. 다른 연구자들은, 분자생물학적 기법과 세포 내 기록법을 동시에 이용하여 뇌간 절편의 내측전정신경핵 신경세포들 중에 glutamate 신경전달물을 가지고 있는 흥분성신경세포와 GABA 신경전달을 갖고 있는 억제성신경세포의 활동전위 특징을 비교 분석하였다[26,27]. 그 결과, 흥분성신경세포와 비교하여 억제성신경세포의 활동전위 파형의 half-valley time이 더 길고 신경세포에 흥분적자극을 가했을 때 자발발화 빈도는 더 낮았다.
한편, 해마 절편에서 흥분성세포인 피라미드세포에서 세포외 기록법과 세포 내 기록법을 동시에 적용하여 활동전위의 파형을 비교 분석한 연구에서는, 두 기록법에서 관찰된 활동전위의 파형은 위상차가 반대로 관찰되었지만 파형의 크기와 진폭은 서로 유사하였다[28].
이러한 기존 연구 결과를 고려한다면, 이 연구에 사용된 세포외 기록법에 의한 spike와 다른 연구자 세포 내 기록법에 의한 신경세포의 활동전위 파형을 직접 비교는 어렵지만, trough to peak time 이 0.3 msec 이내 spike 파형은 흥분성신경세포이며, 0.3 msec 이상의 spike 파형은 억제성신경세포일 가능성이 있다. 하지만, 이러한 추측을 검증하기 위해서는 말초전정기관의 흥분을 유도한 다음 전정신경핵의 흥분성신경세포와 억제성신경세포의 자발발화성의 변화를 초래한 상태에서 spike 파형에 근거한 신경세포들의 흥분성 변화를 관찰하기 위한 추가적 연구가 필요하다. 또한 glutamate 및 GABA 수용체의 길항제 및 작동제를 직접 투여하여 각 spike 파형별로 분류된 신경세포의 흥분성 변화를 확인해 보는 것도 이러한 가설 검증에 도움이 될 것이다.
다음으로, 급성저혈압에 의한 내측전정신경핵 신경세포의 자발발화성의 반응은 앞에 기술한 바와 같이 4가지 형태를 보임을 확인했다. 즉, (1) 저혈압 직후 자발발화성이 빠르게 증가하는 경우, (2) 저혈압 직후 자발발화성이 감소하는 경우, (3) 저혈압유발 후 자발발화성이 점진적으로 증가하는 경우 및 (4) 자발발화성이 변화가 없는 경우로 분류되었다.
다른 기존 연구에서, 이번 연구 결과와 유사하게 회전자극에 의해 구분된 내측전정신경핵의 제 I와 제 II 형 신경세포를 대상으로 급성저혈압을 유발하였을 때, 제 I 형 신경세포는 자발발화성이 증가하였고 제 II 형 신경세포는 자발발화성이 감소함을 보였다[8]. 다만 이 연구에서는 이러한 신경세포의 반응들 이외에 저혈압유발 후 자발발화성이 점진적으로 증가하거나 유의한 변화가 관찰되지 않은 신경세포들도 관찰되었다. 이러한 차이는 기존 연구의 경우, 기능적으로 분류된 2가지 신경세포에서만 관찰하였고, 이 연구는 불특정 신경세포들에서 저혈압의 반응을 관찰하였기 때문일 가능성이 있다.
한편 이 연구에서 spike 파형의 진폭이 큰 신경세포들 중에서 급성저혈압유발 후 진폭이 감소하고 이러한 감소가 혈압이 정상으로 회복된 후에도 지속되는 경향을 보였는데, 이는 기존 연구와 다른 결과였다[8]. 신경세포의 spike 진폭의 감소에 대한 정확한 기전은 정확히 밝혀진 봐 없으나, 일반적으로 자발발화의 빈도 증가에 따른 이온채널의 활동성 변화, 흥분성 및 억제성신경전달물질의 농도변화, 및 에너지 관련 신경세포의 대사기능 변화에 기인한다[20]. 이러한 현상에 대한 정확한 이유는 밝힐 수 없었지만, 위에 언급한 요인들이 복합적으로 작용했을 가능성이 있으며, 이를 확인하기 위한 추가 연구도 필요하다. 특히 전정신경 핵 신경세포의 포도당 대사율이 매우 높고, 포도당 대사 산물인 젖산 대사가 전정신경핵의 신경세포에서 cFos 단백의 발현에 영향을 미친다는 연구결과들이 보고된 바 있다[29,30]. 이를 고려했을 때, 저자들은 저혈압유발이 내측 전정신경핵 신경세포에서 에너지 대사에 영향을 미쳐 신경세포의 활동전위의 진폭에 영향을 미쳤을 가능성을 추정하였고, 따라서, 에너지 대사가 전정신경핵 신경세포의 활동전위에 미치는 영향에 대한 추후 연구를 계획하였다.
마지막으로, 이 연구는 테트로드 전극과 다채널 세포외 전기생리 기록장치의 하드웨어와 spike 분류를 위한 통계학적 분석 기법을 이용하여 내측전정신경핵 신경세포의 활동전위인 spike를 기록 후 spike의 전기생리학적 특징을 기반으로 신경세포를 분류하였다. 이후 급성저혈압유발 후 신경세포의 자발발화성 변화에서 4가지 유형을 관찰하였다.
이번 연구를 통하여 전정신경핵 신경세포의 전기적 활동성을 분석할 수 있는 새로운 연구기법을 제공할 수 있었으며, 급성저혈압이 전정신경핵 신경세포에서 다양한 흥분성 변화를 초래하고, 혈압이 정상으로 회복되어도 신경세포의 흥분성이 지속적인 변화함을 확인하였다.

저자들은 이 논문과 관련하여 이해관계의 충돌이 없음을 명시합니다.

이 과제는 2018학년도 원광대학교 교내연구비로 수행됨.
Fig. 1.
Histologic verification for the location of tetrode electrode in the medial vestibular nucleus (MVN). (A) A photograph presents the location of electrolytic lesion (arrow) indicating tip of tetrode in the MVN. (B) Schematic drawing shows regional distribution of recording site at the MVN of 7 rats. CB, cerebellum.
rvs-17-4-142f1.jpg
Fig. 2.
Classification of spikes in the medial vestibular nucleus. (A) Spike sorting by principal component analysis and K-mean method that was used to separate single neurons (unit) from multiunits. Three units (1, 2, 3) were well isolated after the spike sorting. (B-1, C-2, D-3) Upper panel, 4 different shapes of each spike recorded from single tetrode electrode. Lower panel, different excitation patterns revealed by interspike interval histogram and auto-correlogram in each unit.
rvs-17-4-142f2.jpg
Fig. 3.
Electrophysiological characterization of spikes in the medial vestibular nucleus. (A) Typical 3 different wave forms of multiunit spikes that were already sorted by principal component analysis. Once sorted, the waveforms of spike can be averaged to yield values of the waveform half-width and the trough-to-peak time. (B) Plot of trough-to-peak time by the number of neurons. The plot appears to have some bimodality. (C) Plot of half width time of spike by the number of neurons. The plot appears to have single modality. (D) Scatter plot of all peak-to-peak times and half-widths for each individual neuron. This plot indicates bimodal distribution of spikes (n=77).
rvs-17-4-142f3.jpg
Fig. 4.
Representative recordings for simultaneous changes in spontaneous firing of 3 different units following intravenous injection of sodium nitroprusside (10 μ g/kg). (A) Changes in arterial blood pressure (ABP). Treatment of nitroprusside caused about 30% of reduction of baseline value in ABP. (B1–3) Changes in firing rate of 3 different units. (C) Changes in shape of spikes following acute hypotension. There is a significant reduction in amplitude of large-sized spike following acute arterial hypotension.
rvs-17-4-142f4.jpg
Fig. 5.
Summary of changes in spontaneous firing activity of medial vestibular nucleus (MVN) neurons following acute arterial hypotension. (A) Time-dependent changes in firing rate of total 20 MVN neurons of 5 rats following acute arterial hypotension. (B) Time-dependent changes in mean firing rate of upregulation group (red) and down regulation group (blue) that showed increase and decrease in firing activity, respectively. Values are mean±standard deviation of upregulation group (n=13) and of down regulation group (n=4), respectively. (C) Histograph presents 4 types of responsiveness in spontaneous firing by number of neurons following acute arterial hypotension.
rvs-17-4-142f5.jpg
  • 1. Newman-Toker DE, Dy FJ, Stanton VA, Zee DS, Calkins H, Robinson KA. How often is dizziness from primary cardiovascular disease true vertigo? A systematic review. J Gen Intern Med 2008;23:2087–94.ArticlePubMedPMC
  • 2. Ohashi N, Imamura J, Nakagawa H, Mizukoshi K. Blood pressure abnormalities as background roles for vertigo, dizziness and disequilibrium. ORL J Otorhinolaryngol Relat Spec 1990;52:355–9.ArticlePubMed
  • 3. Jeon EJ, Park YS, Park SN, Park KH, Kim DH, Nam IC, et al. Clinical significance of orthostatic dizziness in the diagnosis of benign paroxysmal positional vertigo and orthostatic intolerance. Am J Otolaryngol 2013;34:471–6.ArticlePubMed
  • 4. Newman-Toker DE, Camargo CA Jr. 'Cardiogenic vertigo'--true vertigo as the presenting manifestation of primary cardiac disease. Nat Clin Pract Neurol 2006;2:167–72.ArticlePubMedPDF
  • 5. Choi JH, Seo JD, Kim MJ, Choi BY, Choi YR, Cho BM, et al. Vertigo and nystagmus in orthostatic hypotension. Eur J Neurol 2015;22:648–55.ArticlePubMed
  • 6. Kim MS, Hyo Kim J, Kry D, Ae Choi M, Ok Choi D, Gon Cho B, et al. Effects of acute hypotension on expression of cFos-like protein in the vestibular nuclei of rats. Brain Res 2003;962:111–21.ArticlePubMed
  • 7. Kim MS, Choi DO, Choi MA, Kim JH, Kim KY, Lee MY, et al. Immunohistochemical detection of phosphorylated form of extracellular signal-regulated kinase 1/2 in rat vestibular nuclei following hemorrhagic hypotension. Neurosci Lett 2004;360:49–52.ArticlePubMed
  • 8. Park BR, Kim MS, Kim JH, Jin YZ. Effects of acute hypotension on neuronal activity in the medial vestibular nuclei of rats. Neuroreport 2001;12:3821–4.ArticlePubMed
  • 9. Gray CM, Maldonado PE, Wilson M, McNaughton B. Tetrodes markedly improve the reliability and yield of multiple single-unit isolation from multi-unit recordings in cat striate cortex. J Neurosci Methods 1995;63:43–54.ArticlePubMed
  • 10. Mechler F, Victor JD, Ohiorhenuan I, Schmid AM, Hu Q. Three-dimensional localization of neurons in cortical tetrode recordings. J Neurophysiol 2011;106:828–48.ArticlePubMedPMC
  • 11. Lefebvre B, Yger P, Marre O. Recent progress in multi-electrode spike sorting methods. J Physiol Paris 2016;110(4 Pt A):327–35.ArticlePubMed
  • 12. Santos L, Opris I, Fuqua J, Hampson RE, Deadwyler SA. A novel tetrode microdrive for simultaneous multi-neuron recording from different regions of primate brain. J Neurosci Methods 2012;205:368–74.ArticlePubMedPMC
  • 13. Maurer AP, Cowen SL, Burke SN, Barnes CA, McNaughton BL. Phase precession in hippocampal interneurons showing strong functional coupling to individual pyramidal cells. J Neurosci 2006;26:13485–92.ArticlePubMedPMC
  • 14. Ferguson JE, Boldt C, Redish AD. Creating low-impedance tetrodes by electroplating with additives. Sens Actuators A Phys 2009;156:388–93.ArticlePubMedPMC
  • 15. Paxinos G, Watson C. The rat brain in stereotaxic coordinates. 6th ed. New York: Academic Press; 2007.Article
  • 16. Murofushi T, Curthoys IS, Gilchrist DP. Response of guinea pig vestibular nucleus neurons to clicks. Exp Brain Res 1996;111:149–52.ArticlePubMed
  • 17. Sun Y, Waller HJ, Godfrey DA, Rubin AM. Spontaneous activity in rat vestibular nuclei in brain slices and effects of acetylcholine agonists and antagonists. Brain Res 2002;934:58–68.ArticlePubMed
  • 18. Courjon JH, Precht W, Sirkin DW. Vestibular nerve and nuclei unit responses and eye movement responses to repetitive galvanic stimulation of the labyrinth in the rat. Exp Brain Res 1987;66:41–8.ArticlePubMed
  • 19. Pettersen KH, Einevoll GT. Amplitude variability and extracellular low-pass filtering of neuronal spikes. Biophys J 2008;94:784–802.ArticlePubMedPMC
  • 20. Stratton P, Cheung A, Wiles J, Kiyatkin E, Sah P, Windels F. Action potential waveform variability limits multi-unit separation in freely behaving rats. PLoS One 2012;7:e38482.ArticlePubMedPMC
  • 21. Precht W, Shimazu H. Functional connections of tonic and kinetic vestibular neurons with primary vestibular afferents. J Neurophysiol 1965;28:1014–28.ArticlePubMed
  • 22. Ayyildiz M, Kozan R, Agar E, Kaplan S. Sexual dimorphism in the medial vestibular nucleus of adult rats: stereological study. Anat Sci Int 2008;83:131–9.ArticlePubMed
  • 23. Moore JJ, Ravassard PM, Ho D, Acharya L, Kees AL, Vuong C, et al. Dynamics of cortical dendritic membrane potential and spikes in freely behaving rats. Science 2017;355(6331):pii: eaaj1497. https://doi.org/10.1126/science.aaj1497.Article
  • 24. du Lac S, Lisberger SG. Membrane and firing properties of avian medial vestibular nucleus neurons in vitro. J Comp Physiol A 1995;176:641–51.ArticlePubMed
  • 25. Serafin M, de Waele C, Khateb A, Vidal PP, Mühlethaler M. Medial vestibular nucleus in the guinea-pig. I. Intrinsic membrane properties in brainstem slices. Exp Brain Res 1991;84:417–25.ArticlePubMed
  • 26. Takazawa T, Saito Y, Tsuzuki K, Ozawa S. Membrane and firing properties of glutamatergic and GABAergic neurons in the rat medial vestibular nucleus. J Neurophysiol 2004;92:3106–20.ArticlePubMed
  • 27. Bagnall MW, Stevens RJ, du Lac S. Transgenic mouse lines subdivide medial vestibular nucleus neurons into discrete, neurochemically distinct populations. J Neurosci 2007;27:2318–30.ArticlePubMedPMC
  • 28. Henze DA, Borhegyi Z, Csicsvari J, Mamiya A, Harris KD, Buzsáki G. Intracellular features predicted by extracellular recordings in the hippocampus in vivo. J Neurophysiol 2000;84:390–400.ArticlePubMed
  • 29. Patil GD, Briski KP. Lactate is a critical "sensed" variable in caudal hindbrain monitoring of CNS metabolic stasis. Am J Physiol Regul Integr Comp Physiol 2005;289:R1777–86.ArticlePubMed
  • 30. Luyten WH, Sharp FR, Ryan AF. Regional differences of brain glucose metabolic compensation after unilateral labyrinthectomy in rats: a [14C]2-deoxyglucose study. Brain Res 1986;373:68–80.ArticlePubMed

Figure & Data

References

    Citations

    Citations to this article as recorded by  

      • PubReader PubReader
      • ePub LinkePub Link
      • Cite
        CITE
        export Copy
        Close
        Download Citation
        Download a citation file in RIS format that can be imported by all major citation management software, including EndNote, ProCite, RefWorks, and Reference Manager.

        Format:
        • RIS — For EndNote, ProCite, RefWorks, and most other reference management software
        • BibTeX — For JabRef, BibDesk, and other BibTeX-specific software
        Include:
        • Citation for the content below
        Application of Tetrode Technology for Analysis of Changes in Neural Excitability of Medial Vestibular Nucleus by Acute Arterial Hypotension
        Res Vestib Sci. 2018;17(4):142-151.   Published online December 21, 2018
        Close
      • XML DownloadXML Download
      Figure
      • 0
      • 1
      • 2
      • 3
      • 4
      Related articles
      Application of Tetrode Technology for Analysis of Changes in Neural Excitability of Medial Vestibular Nucleus by Acute Arterial Hypotension
      Image Image Image Image Image
      Fig. 1. Histologic verification for the location of tetrode electrode in the medial vestibular nucleus (MVN). (A) A photograph presents the location of electrolytic lesion (arrow) indicating tip of tetrode in the MVN. (B) Schematic drawing shows regional distribution of recording site at the MVN of 7 rats. CB, cerebellum.
      Fig. 2. Classification of spikes in the medial vestibular nucleus. (A) Spike sorting by principal component analysis and K-mean method that was used to separate single neurons (unit) from multiunits. Three units (1, 2, 3) were well isolated after the spike sorting. (B-1, C-2, D-3) Upper panel, 4 different shapes of each spike recorded from single tetrode electrode. Lower panel, different excitation patterns revealed by interspike interval histogram and auto-correlogram in each unit.
      Fig. 3. Electrophysiological characterization of spikes in the medial vestibular nucleus. (A) Typical 3 different wave forms of multiunit spikes that were already sorted by principal component analysis. Once sorted, the waveforms of spike can be averaged to yield values of the waveform half-width and the trough-to-peak time. (B) Plot of trough-to-peak time by the number of neurons. The plot appears to have some bimodality. (C) Plot of half width time of spike by the number of neurons. The plot appears to have single modality. (D) Scatter plot of all peak-to-peak times and half-widths for each individual neuron. This plot indicates bimodal distribution of spikes (n=77).
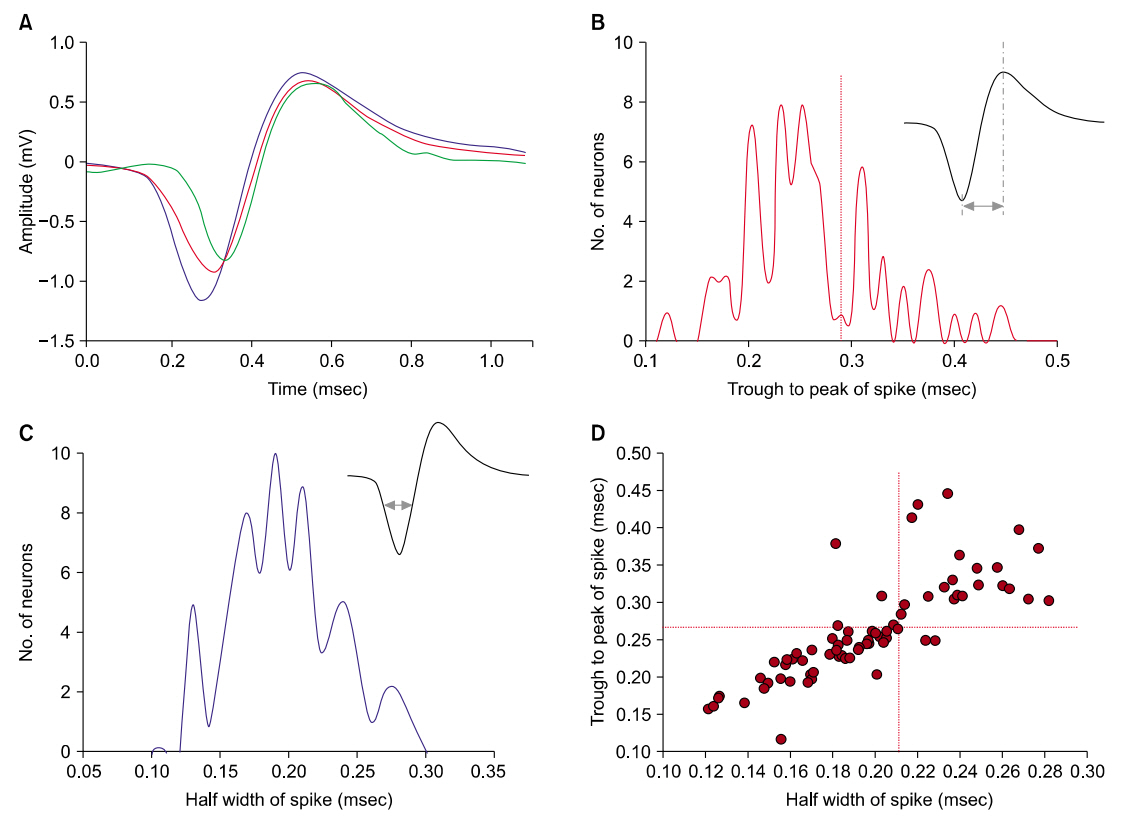
      Fig. 4. Representative recordings for simultaneous changes in spontaneous firing of 3 different units following intravenous injection of sodium nitroprusside (10 μ g/kg). (A) Changes in arterial blood pressure (ABP). Treatment of nitroprusside caused about 30% of reduction of baseline value in ABP. (B1–3) Changes in firing rate of 3 different units. (C) Changes in shape of spikes following acute hypotension. There is a significant reduction in amplitude of large-sized spike following acute arterial hypotension.
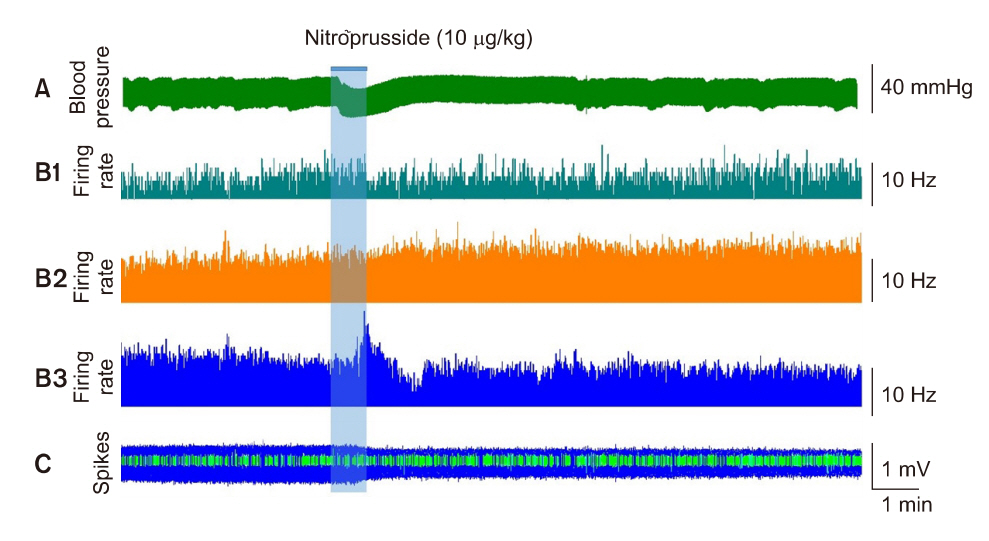
      Fig. 5. Summary of changes in spontaneous firing activity of medial vestibular nucleus (MVN) neurons following acute arterial hypotension. (A) Time-dependent changes in firing rate of total 20 MVN neurons of 5 rats following acute arterial hypotension. (B) Time-dependent changes in mean firing rate of upregulation group (red) and down regulation group (blue) that showed increase and decrease in firing activity, respectively. Values are mean±standard deviation of upregulation group (n=13) and of down regulation group (n=4), respectively. (C) Histograph presents 4 types of responsiveness in spontaneous firing by number of neurons following acute arterial hypotension.
      Application of Tetrode Technology for Analysis of Changes in Neural Excitability of Medial Vestibular Nucleus by Acute Arterial Hypotension

      Res Vestib Sci : Research in Vestibular Science
      TOP